一、在vue2中使用echarts
在vue2中使用echarts,和在原生js中使用echarts步骤差不多,只不过我们需要在mounted钩子中写逻辑代码,具体步骤如下,
安装`echarts``
npm install echarts -S
在main.js中导入
import ECharts from "echarts";
Vue.prototype.$echarts = ECharts;
将其挂载到vue的原型上,这样我们在全局都可以通过this.$echarts来访问echarts了
准备工作做好了,咱们看个例子
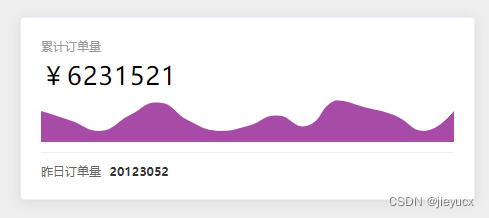
绘制如图所示的一个示例图
<template>
    <div id="total-orders-chart" :style="{ width: '100%', height: '100%' }"></div>
</template>
<script>
export default {


    mounted() {


        const chartDom = document.getElementById('total-orders-chart')
        const chart = this.$echarts.init(chartDom)
        chart.setOption({


            xAxis: {


                type: 'category',
                show: false,
                boundaryGap: false
            },
            yAxis: {


                show: false
            },
            series: [{


                type: 'line',
                data: [620, 432, 220, 534, 790, 430, 220, 320, 532, 320, 834, 690, 530, 220, 620],
                areaStyle: {


                    color: 'purple'
                },
                lineStyle: {


                    width: 0
                },
                itemStyle: {


                    opacity: 0
                },
                smooth: true
            }],
            grid: {


                top: 0,
                bottom: 0,
                left: 0,
                right: 0
            }
        })
    },

}
</script>
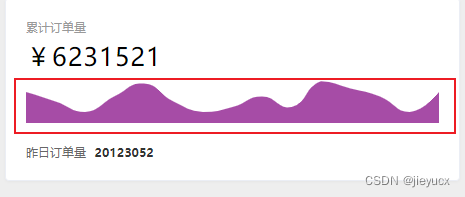
代码只是圈住的图的部分
二、使用vue-echarts同样实现上图例子
还是得先安装,导入
安装
vue-echarts是依赖echarts的,如果你没有安装echarts,记得在安装vue-echarts时一起安装了
npm install echarts vue-echarts -S
导入
import VueECharts from "vue-echarts";
Vue.component("v-chart", VueECharts);
使用vue.component注册组件之后我们全局都可以直接使用<v-chart />组件了
<template>
    <v-chart :options="getOptions()" />
</template>

<script>

export default {


    methods: {


        getOptions() {


            return {


                xAxis: {


                type: 'category',
                show: false,
                boundaryGap: false
            },
            yAxis: {


                show: false
            },
            series: [{


                type: 'line',
                data: [620, 432, 220, 534, 790, 430, 220, 320, 532, 320, 834, 690, 530, 220, 620],
                areaStyle: {


                    color: 'purple'
                },
                lineStyle: {


                    width: 0
                },
                itemStyle: {


                    opacity: 0
                },
                smooth: true
            }],
            grid: {


                top: 0,
                bottom: 0,
                left: 0,
                right: 0
            }
            }
        }
    }
}
</script>
可以看到使用<v-chart /> 组件了之后可以省去那些繁琐的获取dom和初始化操作
三、使用v-charts
v-charts官网
同样的安装导入,v-charts同样依赖echarts
安装
vue-echarts是依赖echarts的,如果你没有安装echarts,记得在安装vue-echarts时一起安装了
npm install echarts v-charts -S
导入
import VCharts from 'v-charts'
import 'v-charts/lib/style.css'
Vue.use(VCharts)
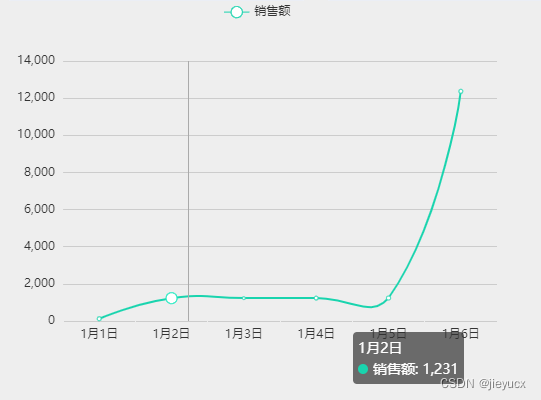
示例:
<template>
  <div style="width: 500px; height: 500px;">
    <ve-line :data="data"></ve-line>
  </div>
</template>

<script>
/* eslint-disable */
export default {


  name: 'salesView',
  data() {


    return {


      data: {


        columns: ['日期', '销售额'],
        rows: [
          {

     '日期': '1月1日', '销售额': 123 },
          {

     '日期': '1月2日', '销售额': 1231 },
          {

     '日期': '1月3日', '销售额': 1232 },
          {

     '日期': '1月4日', '销售额': 1233},
          {

     '日期': '1月5日', '销售额': 1236 },
          {

     '日期': '1月6日', '销售额': 12367 },
        ]
      }
    }
  }
}
</script>

<style lang="scss" scoped></style>