目录
1. 配置文件conf/defaults.ini修改
将conf/defaults.ini的如下内容
#################################### SMTP / Emailing #####################
[smtp]
enabled = false
host = localhost:25
user =
# If the password contains # or ; you have to wrap it with triple quotes. Ex """#password;"""
password =
cert_file =
key_file =
skip_verify = false
from_address = [email protected]
from_name = Grafana
ehlo_identity =
startTLS_policy =

[emails]
welcome_email_on_sign_up = false
templates_pattern = emails/*.html, emails/*.txt
content_types = text/html

#################################### Logging ##########################
修改成
#################################### SMTP / Emailing #####################
[smtp]
enabled = true
host = smtp.qq.com:465
user = [email protected]
# If the password contains # or ; you have to wrap it with triple quotes. Ex """#password;"""
password = QQ邮箱授权码
cert_file =
key_file =
skip_verify = true
from_address = [email protected]
from_name = Grafana
ehlo_identity =
startTLS_policy =

[emails]
welcome_email_on_sign_up = false
templates_pattern = emails/*.html, emails/*.txt
content_types = text/html

#################################### Logging ##########################
然后重启Grafana
2. Grafana Web页面配置报警邮箱接收者
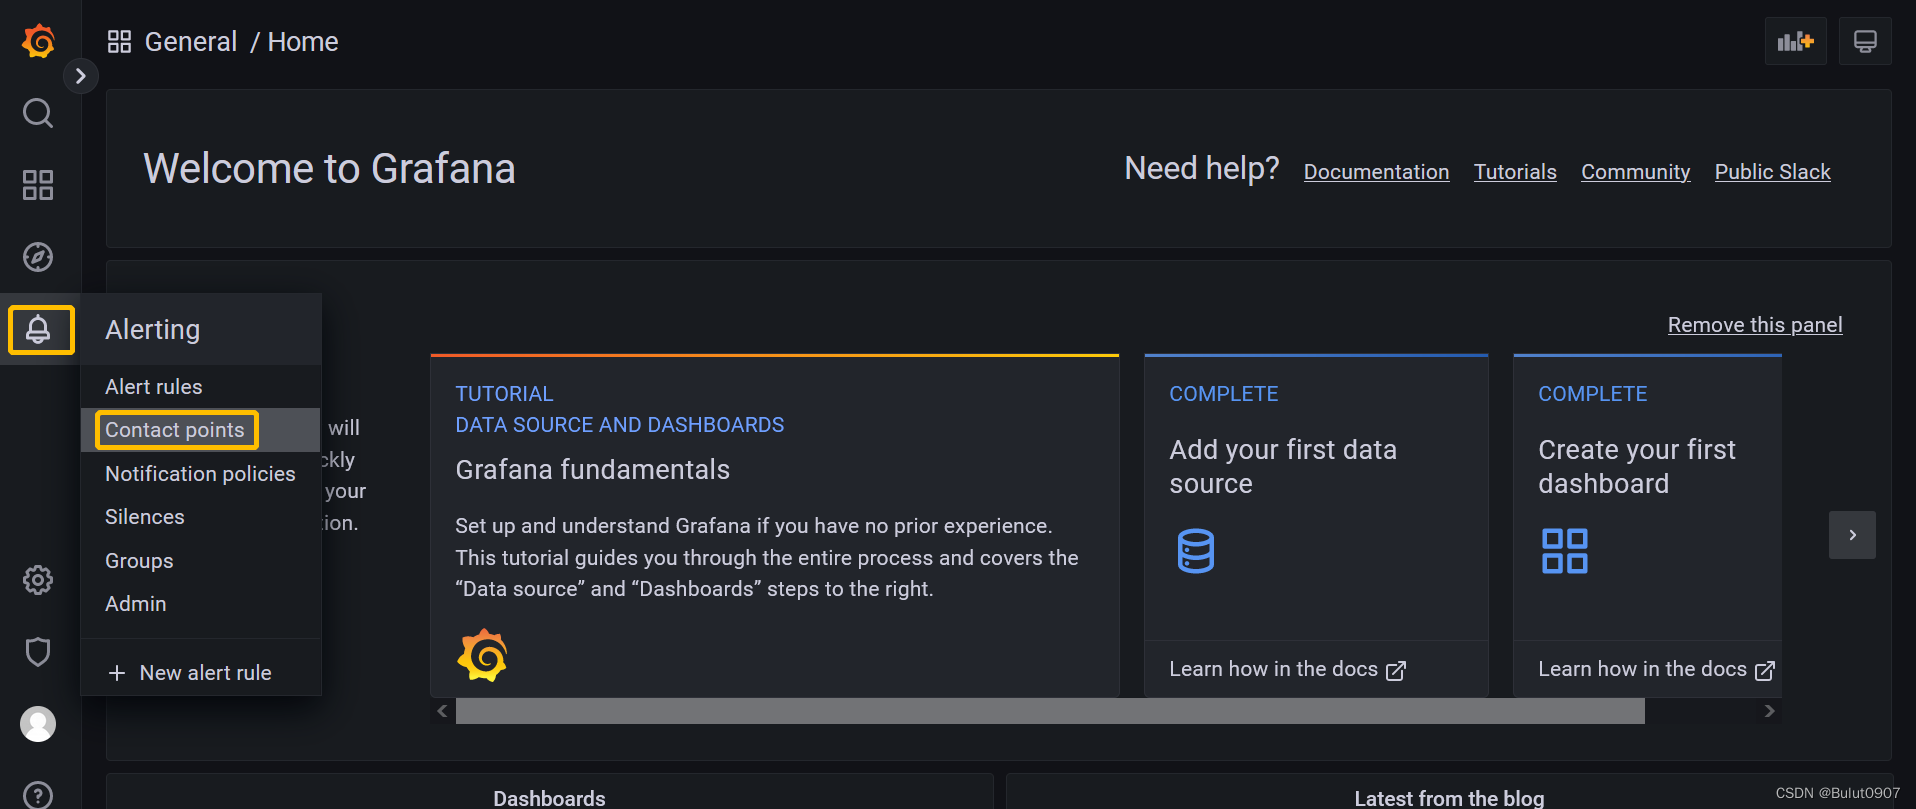

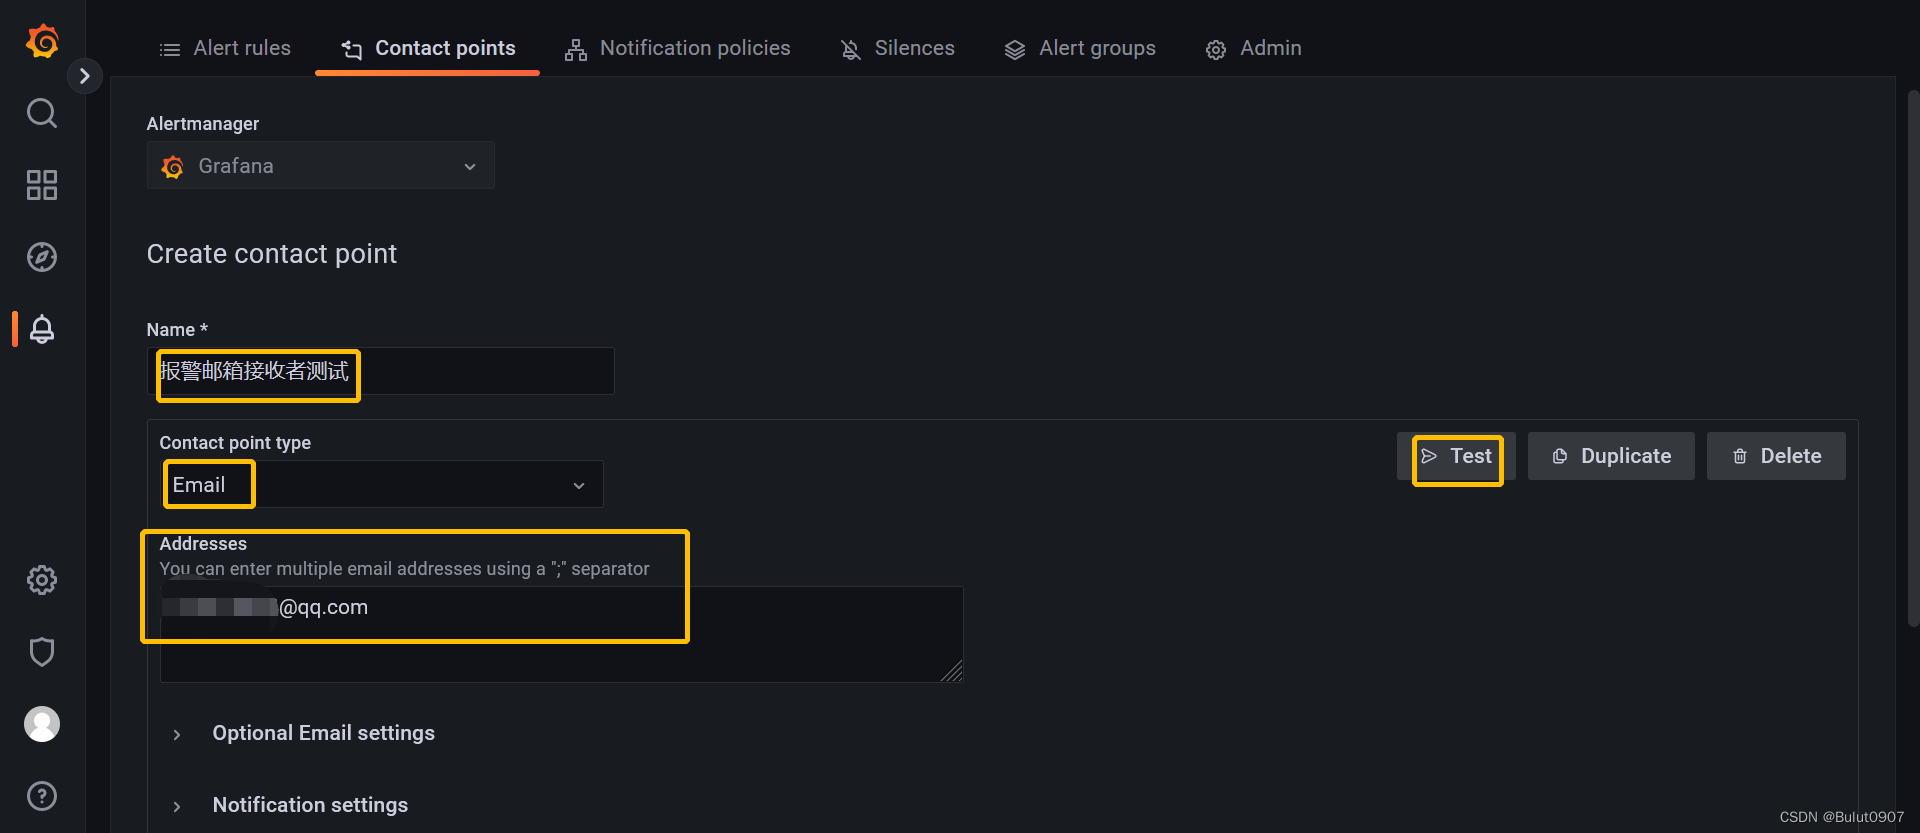 输入Name,选择类型为Email,再输入接收者邮件地址。点击Test进行测试,再点击Send test notification发送一条Predifiend的消息
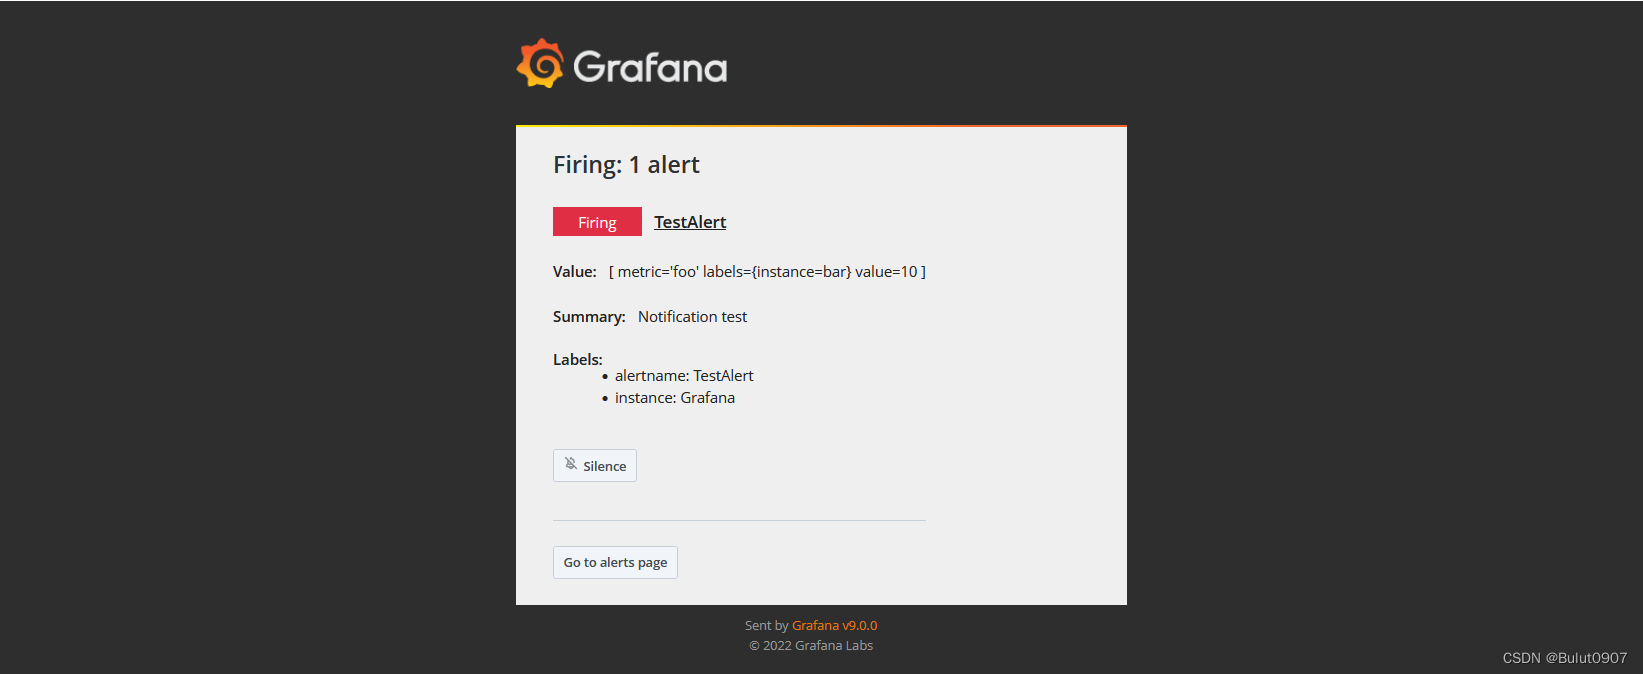
如果能接收到邮件,如上所示,说明设置成功
3. 创建Dashboard

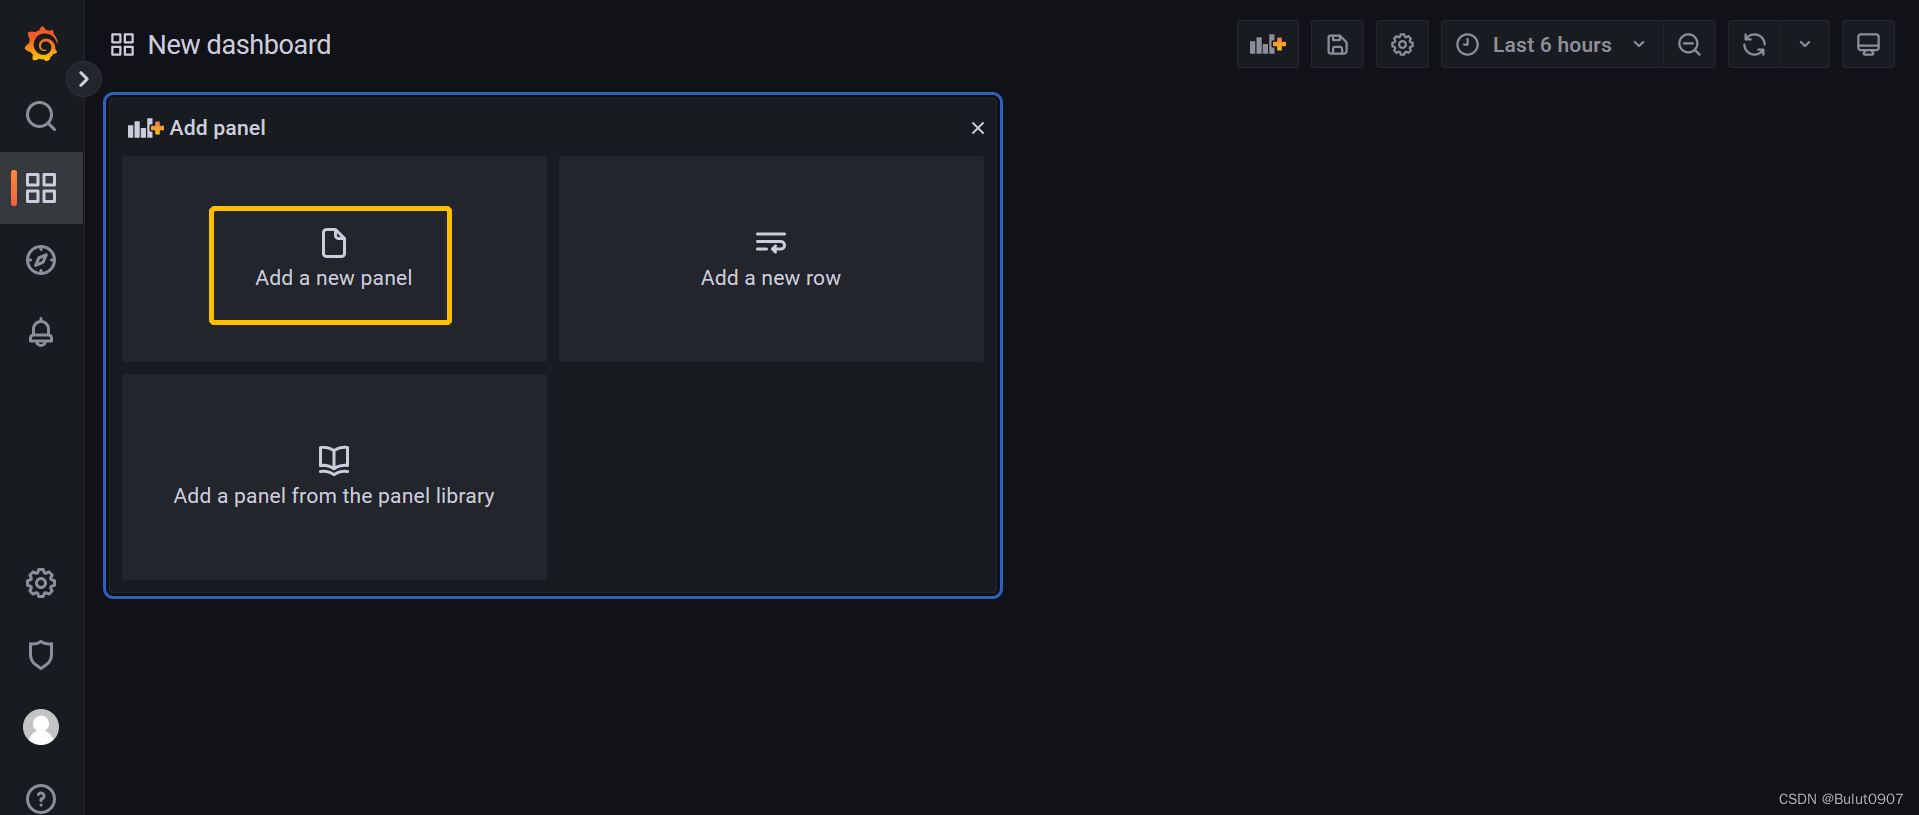
 点击保存图表,然后输入Dashboard name,点击Save进行保存
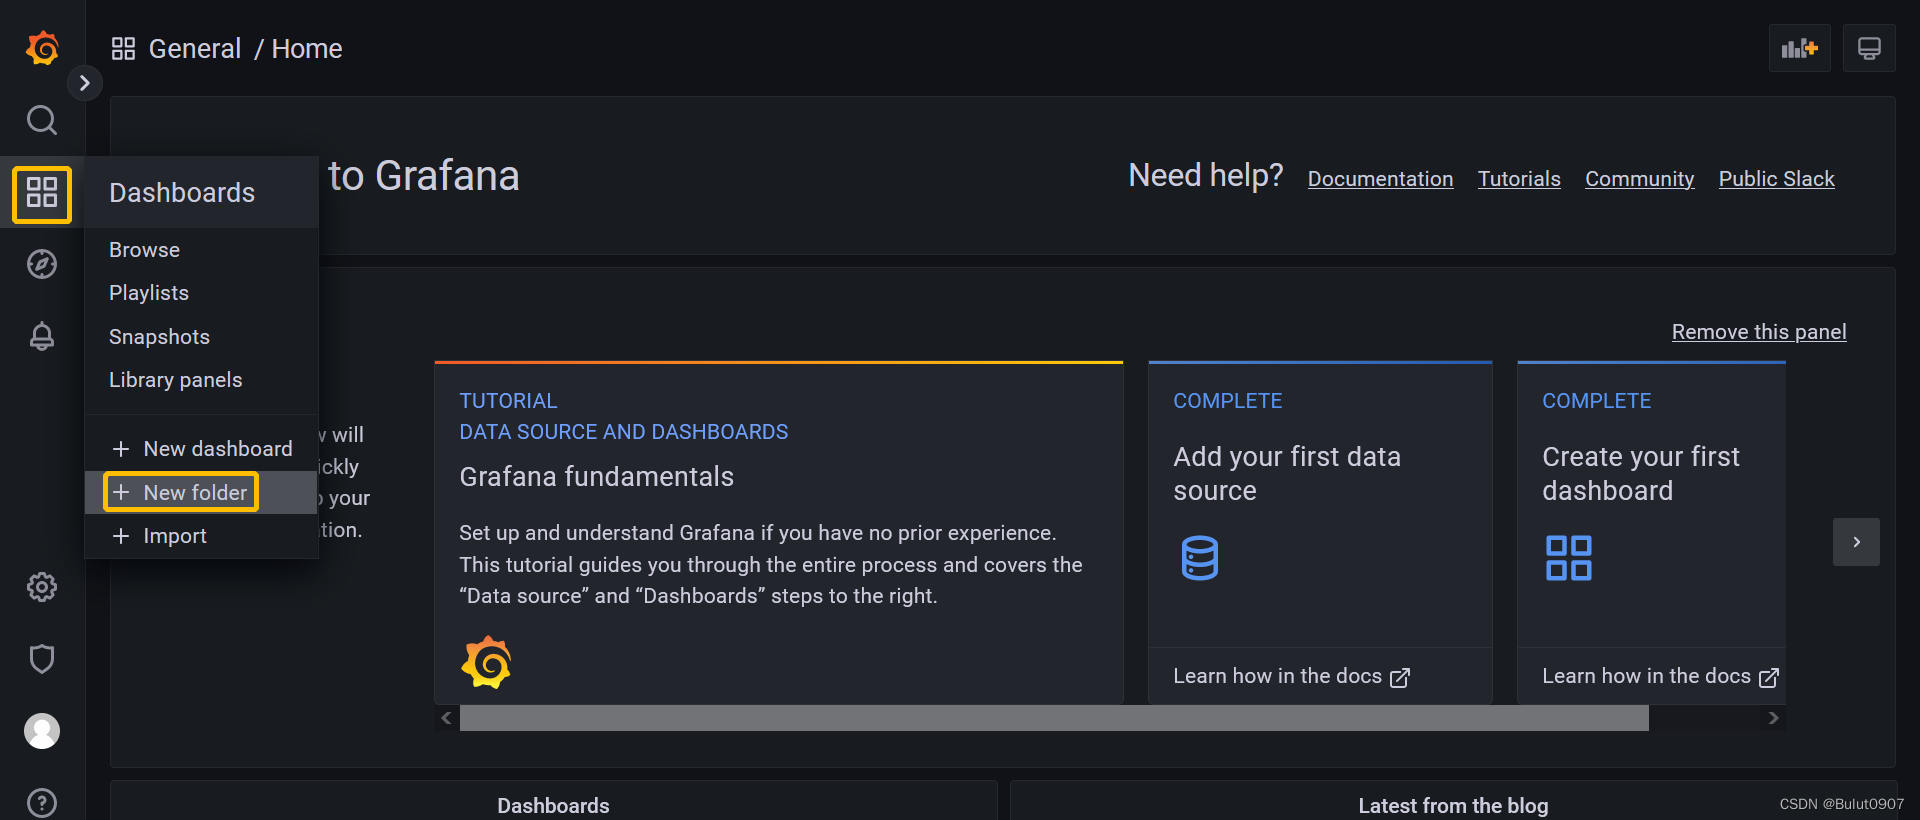
4. 创建Alert的文件夹
创建一个文件夹,用来储存Alert Rule

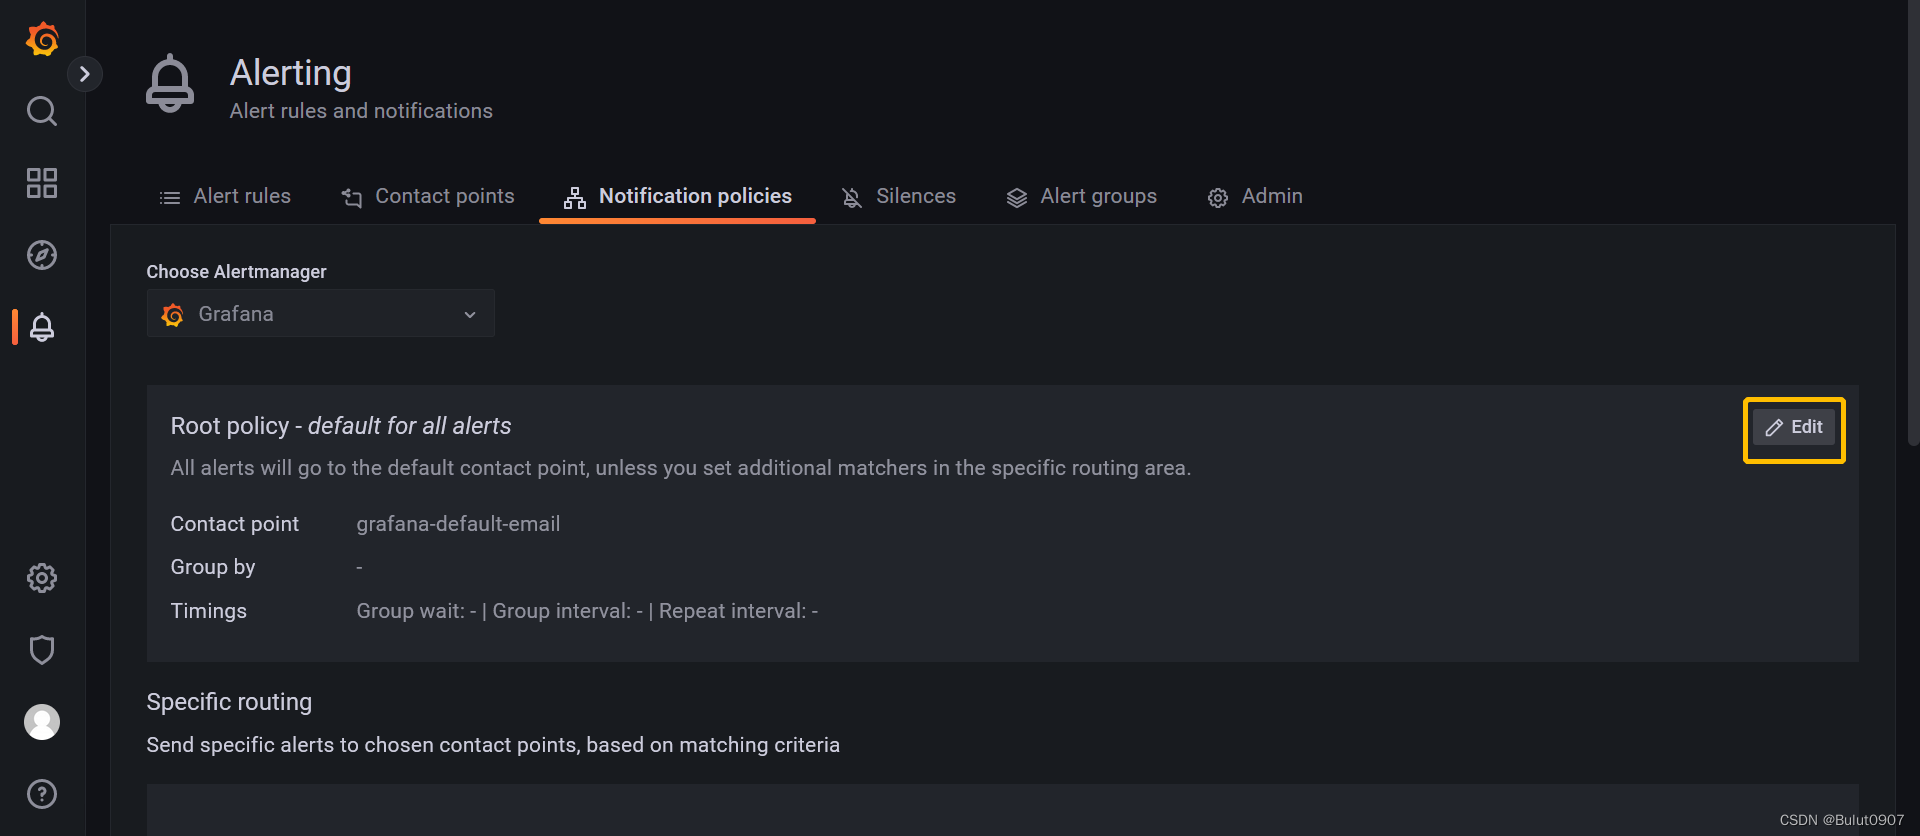
5. 设置Notification policies
因为Alert Rule是通过label来匹配Contact point。所以需要定义一个Notification policy,给Contact point定义label
Grafana的所有Alert Rule报警都会发送给Root policy,但是Root policy的Contact point是无法接收邮件的。所以需要修改Root policy的Contact point
如果Specific routing和Root policy是同一个Contact point,则只会收到一封报警邮件,而不是两封
操作步骤如下
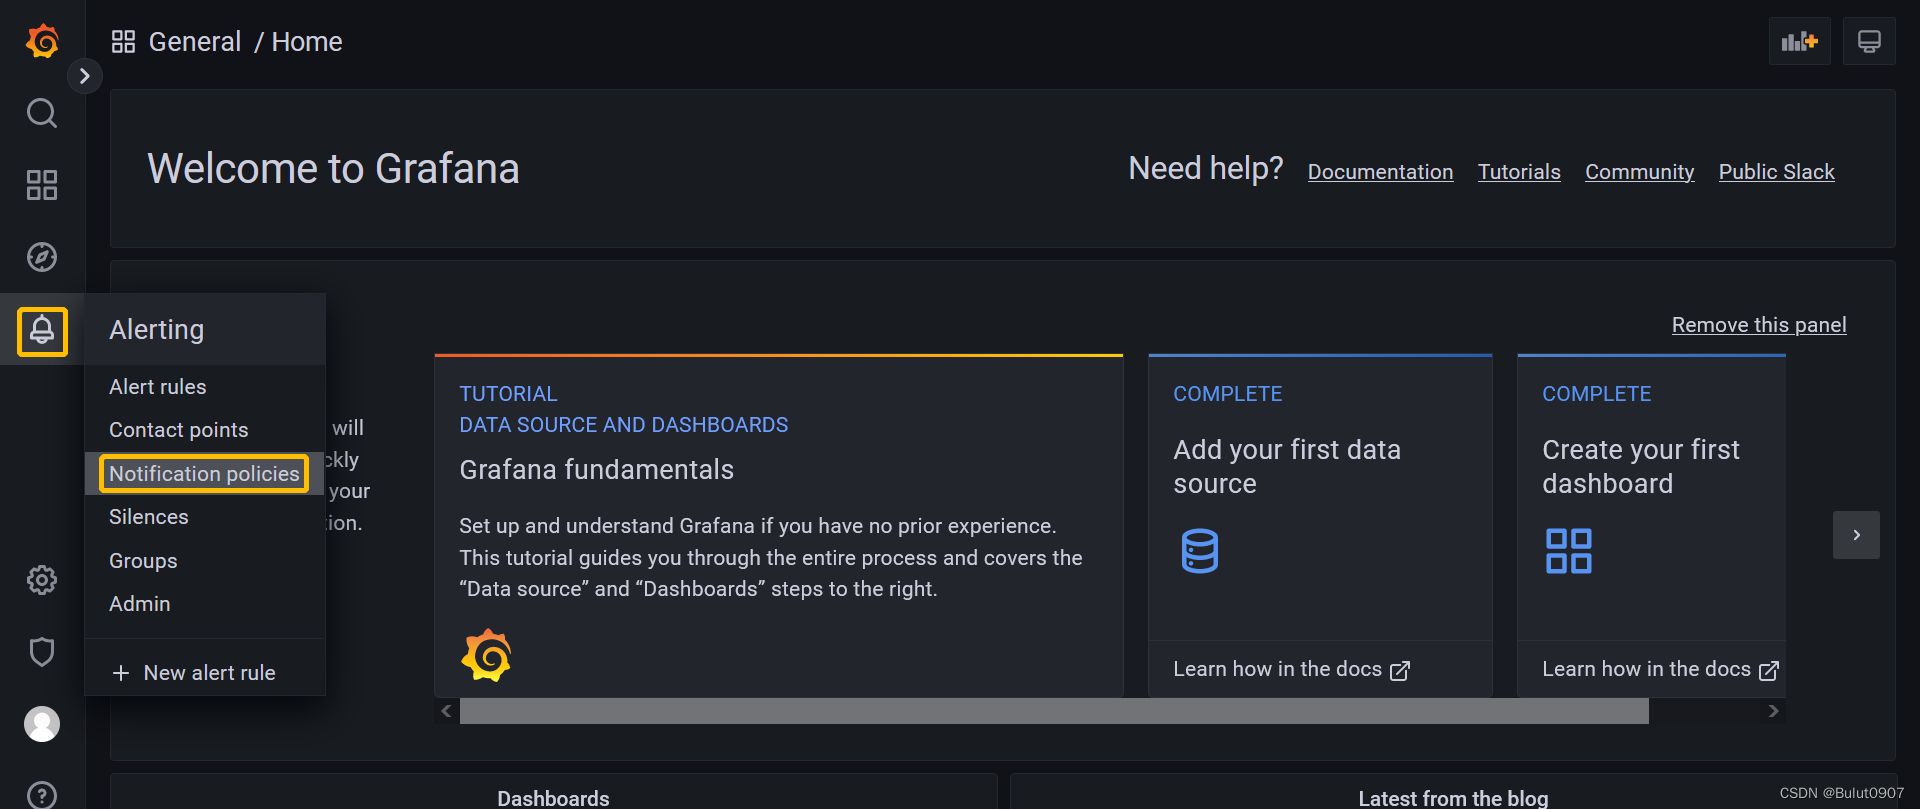
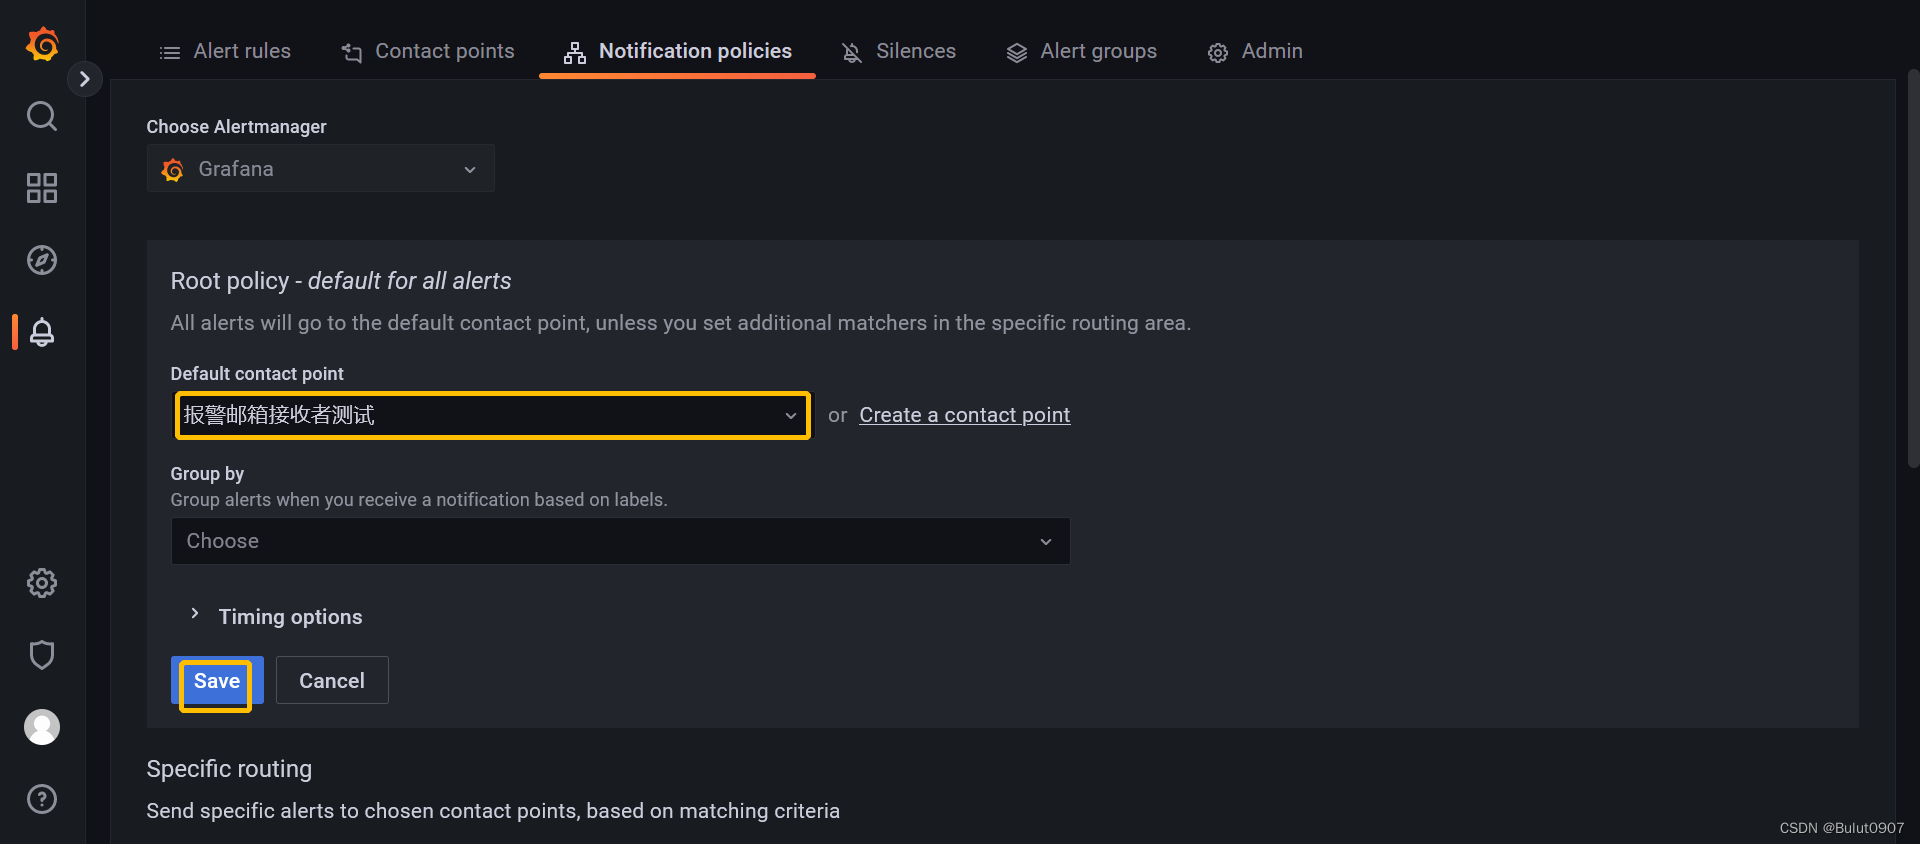
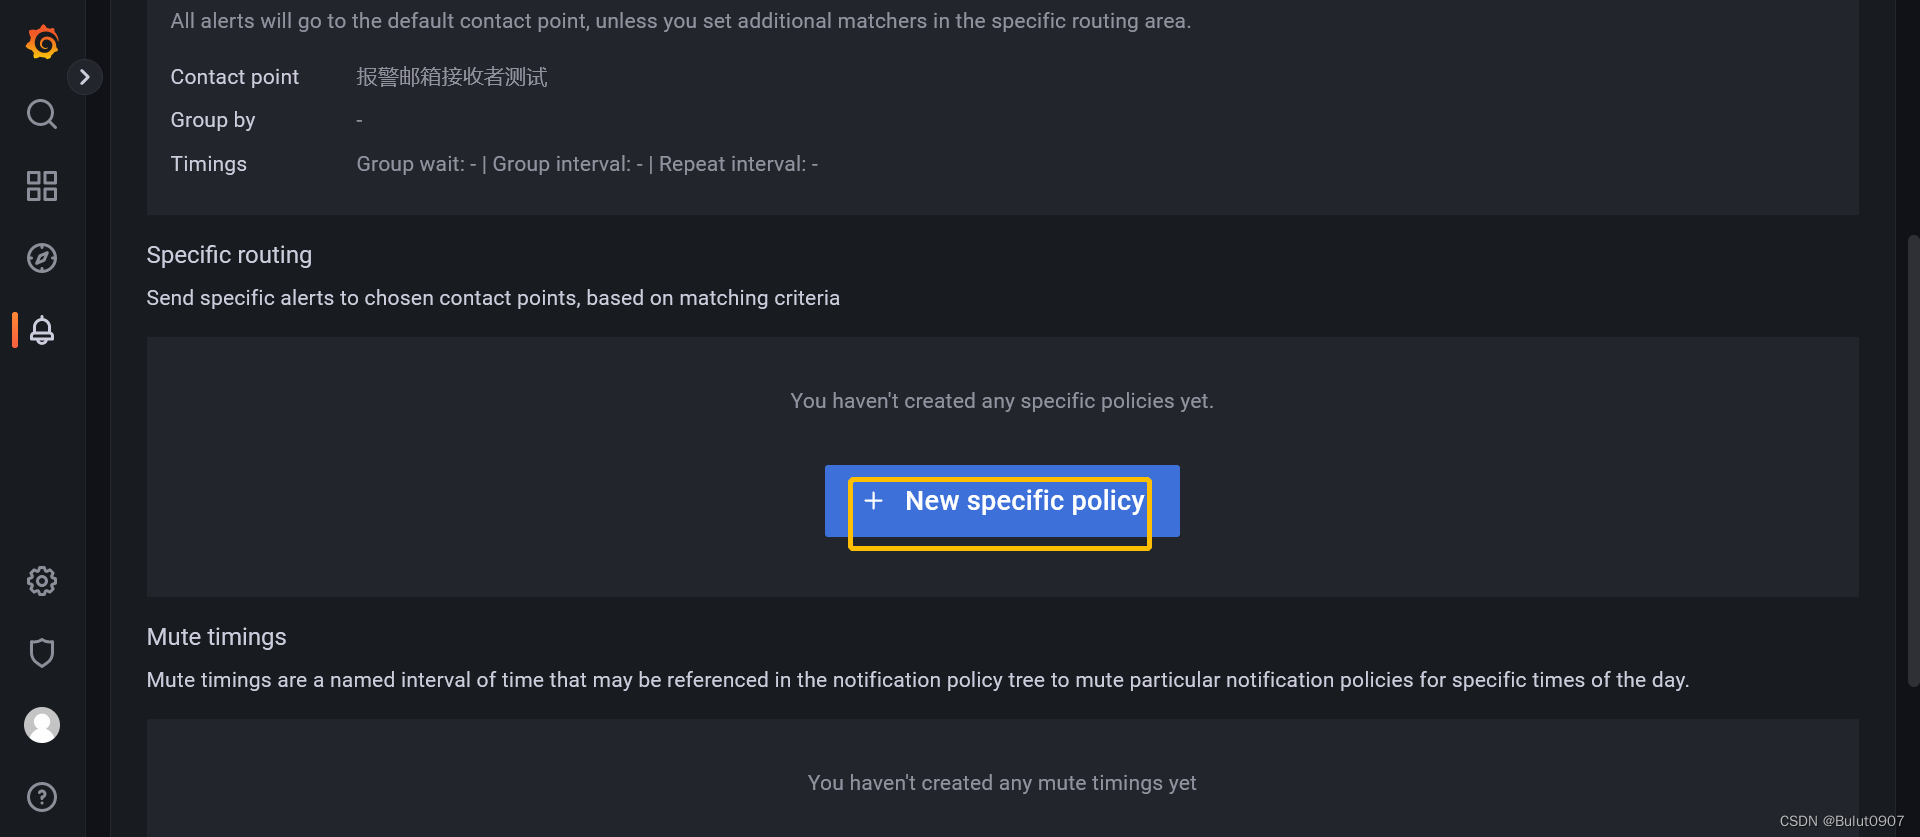
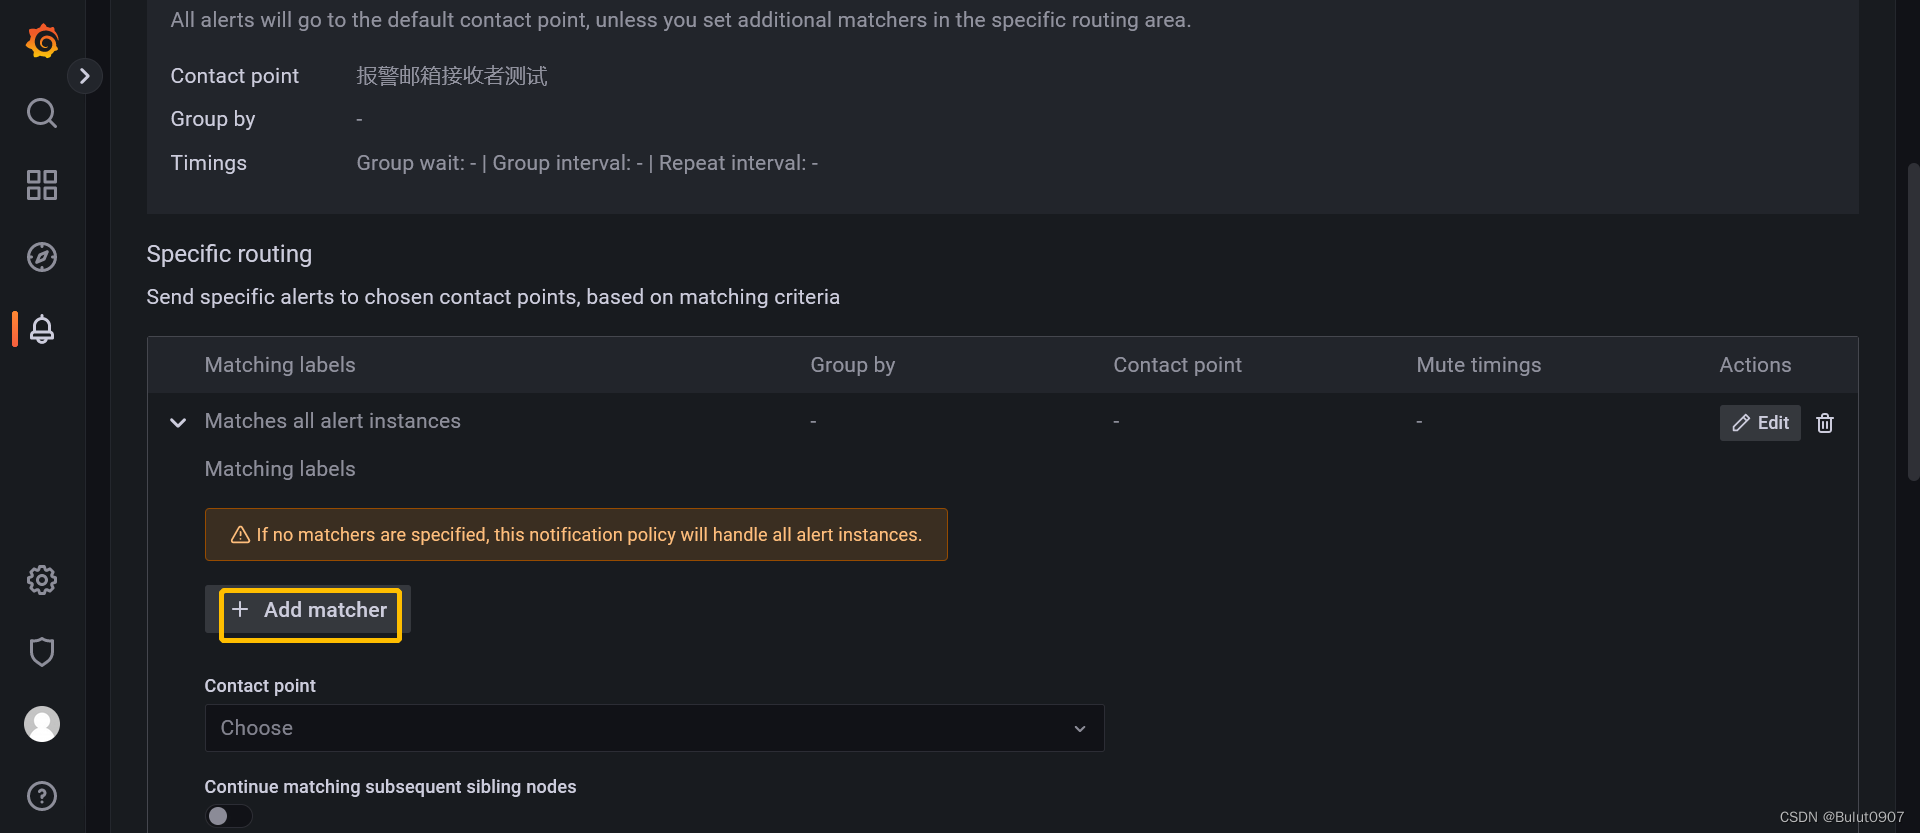
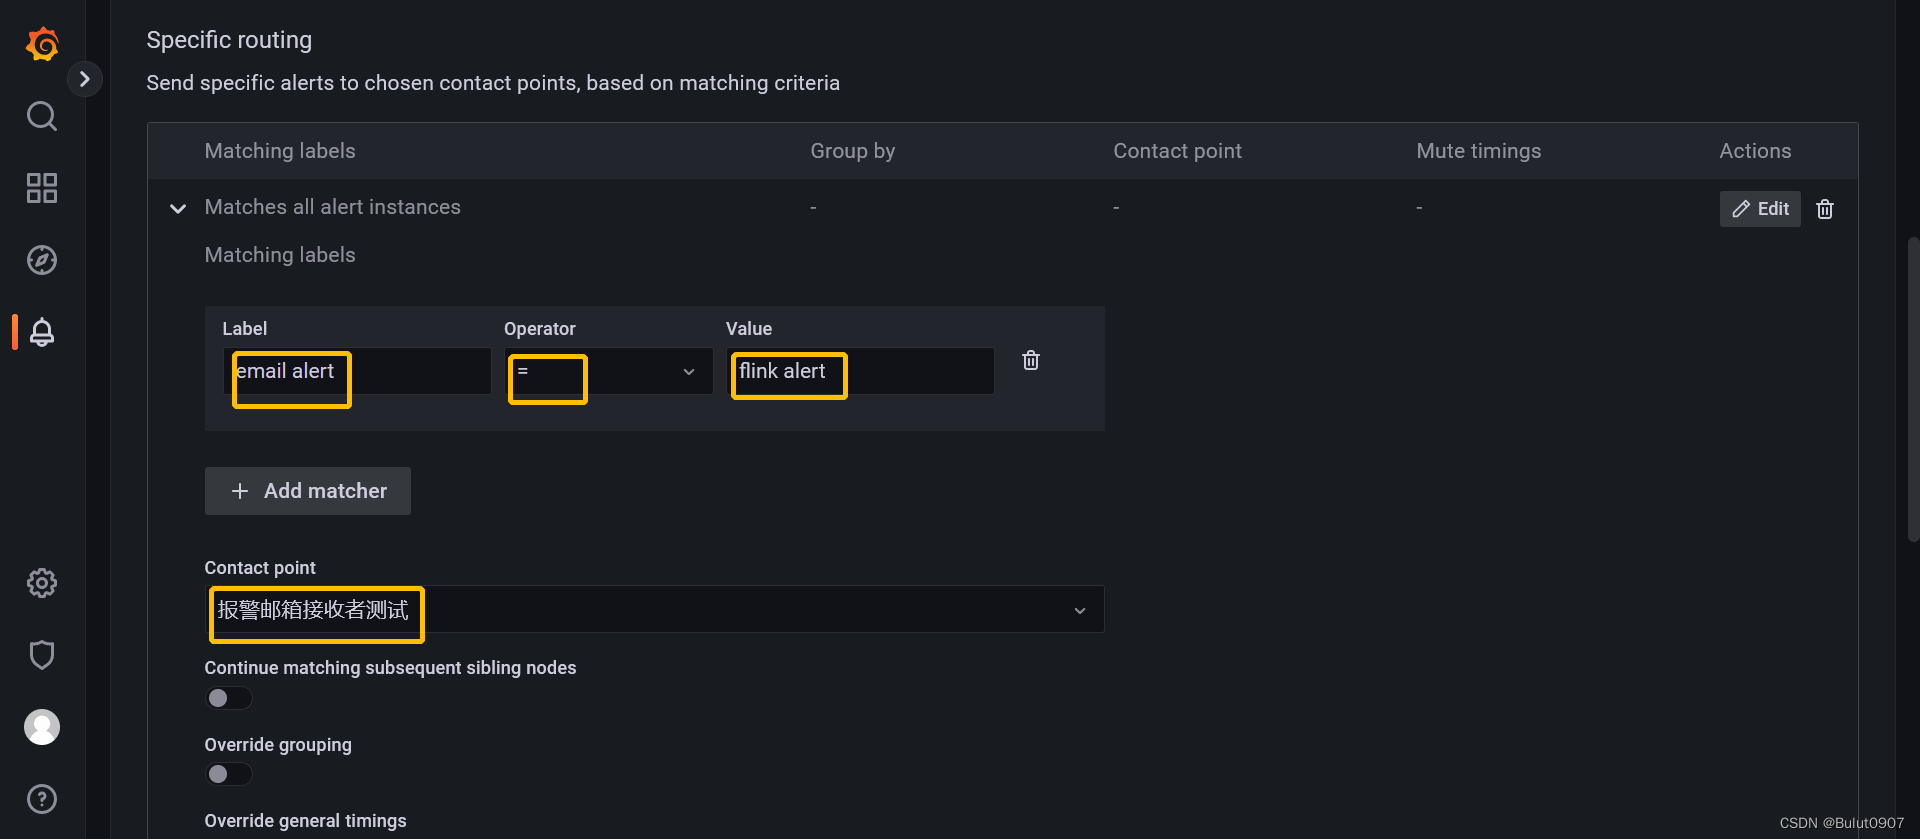
定义label,然后选择Contact point,最后点击Save policy进行保存
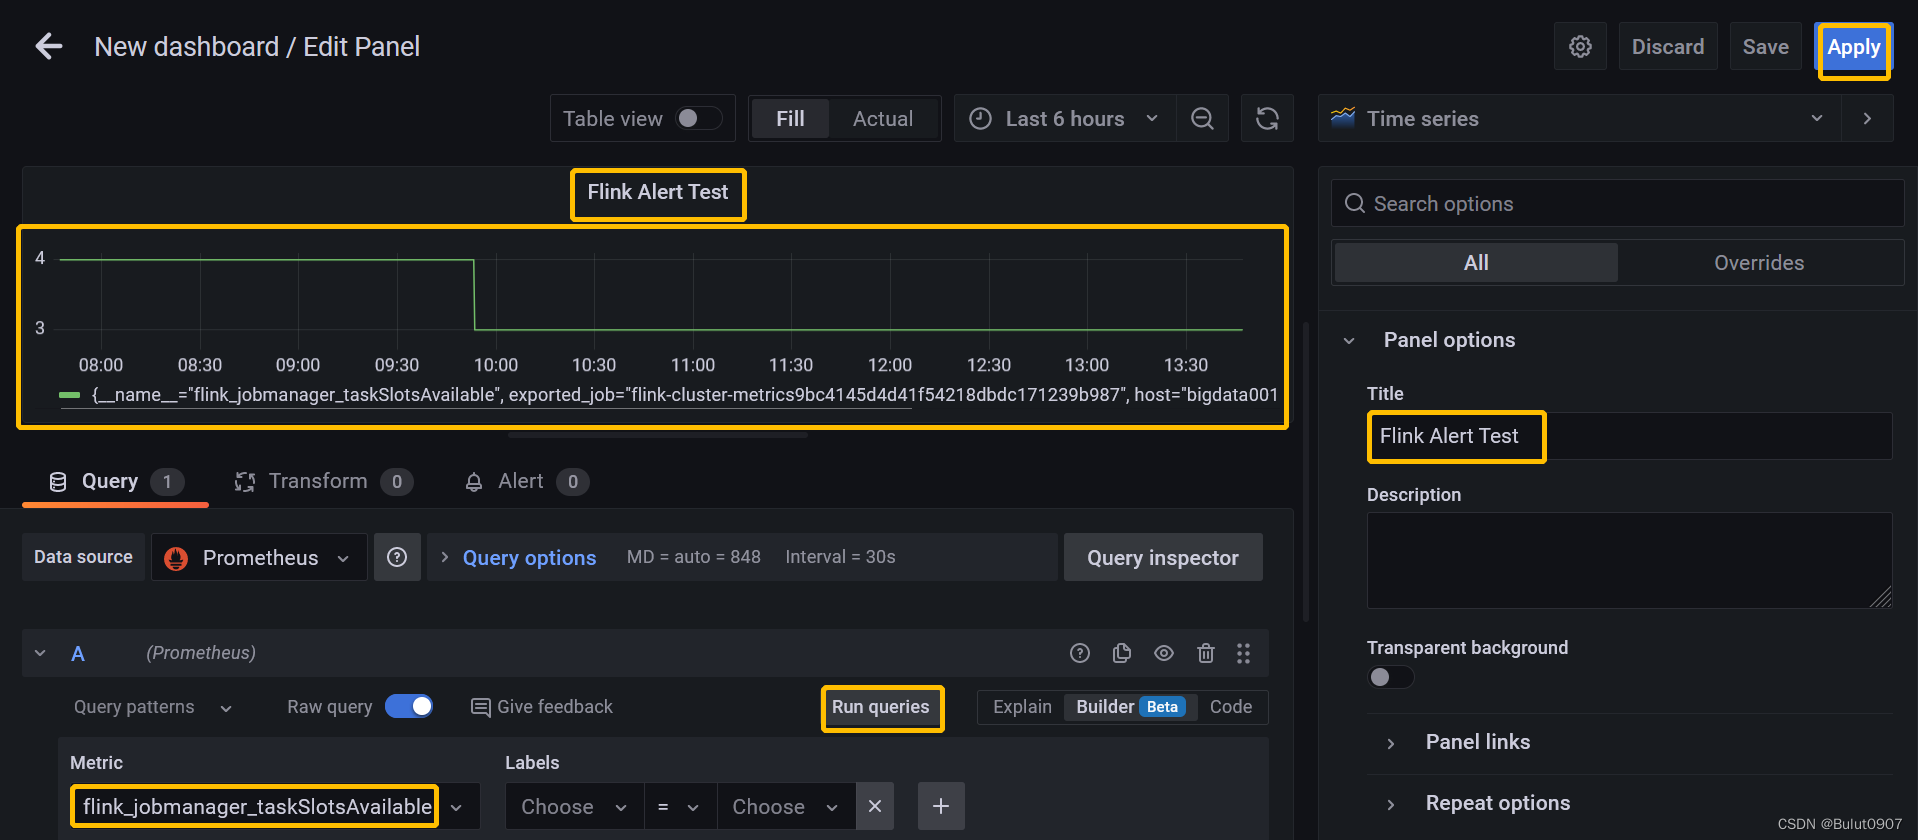
6. 添加Alert
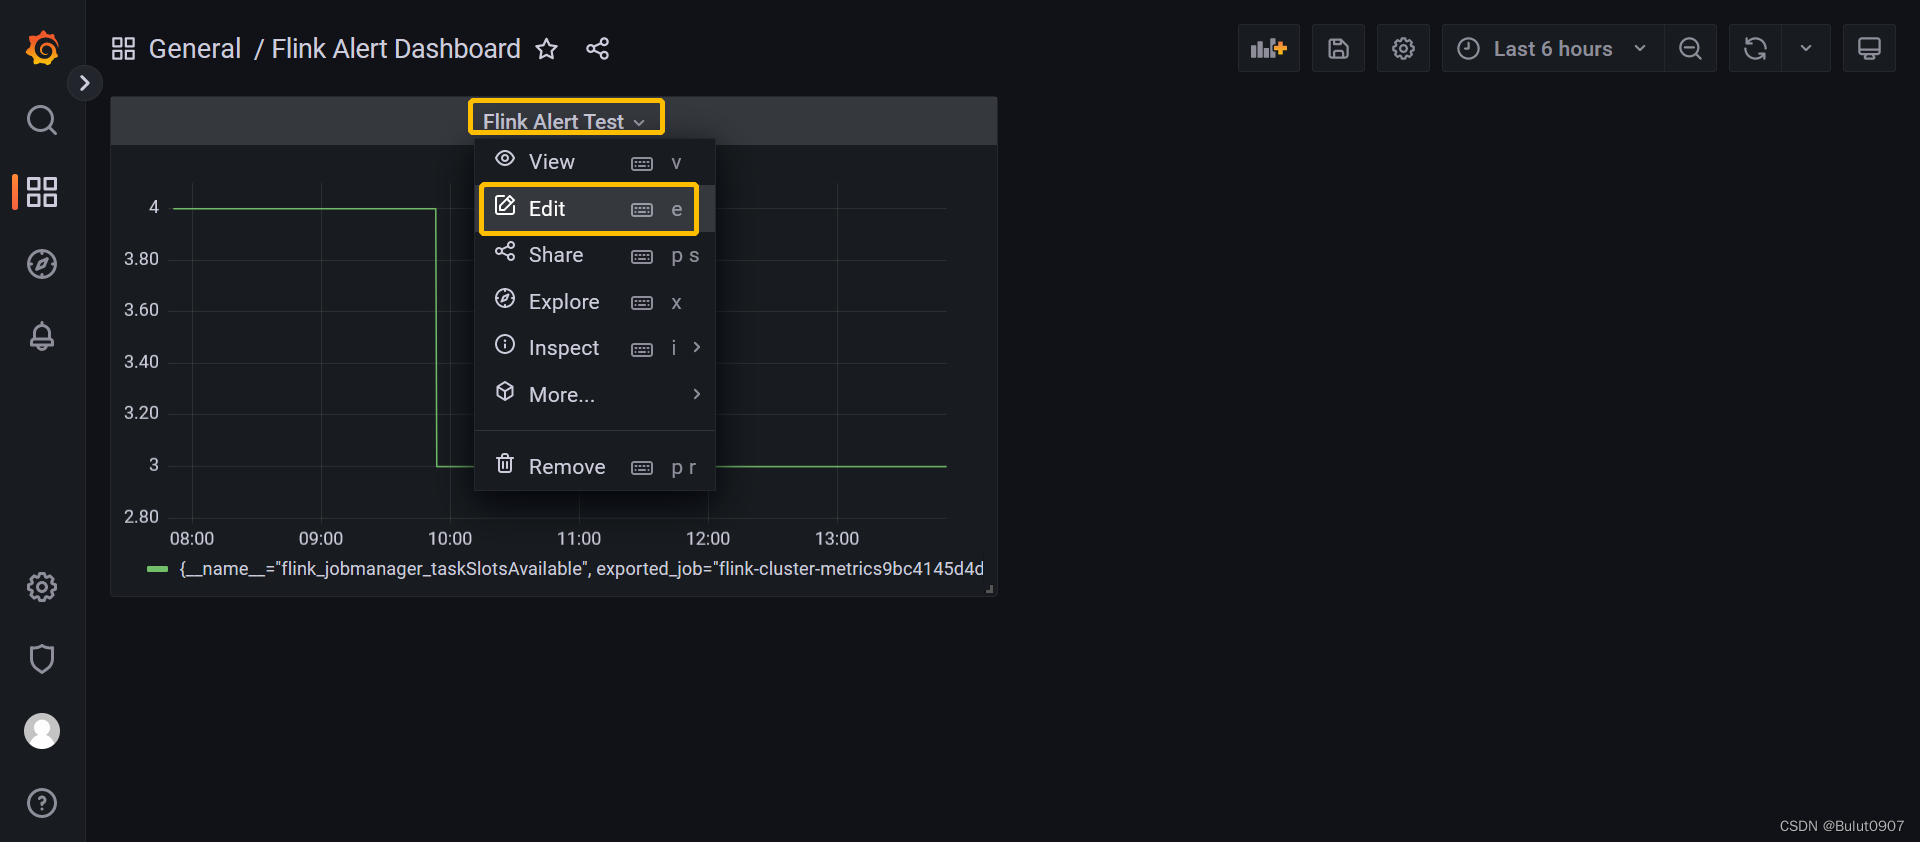
 点击Alert,再点击【Create alert rule from this panel】,再点击Save dashboard。最后点击Save
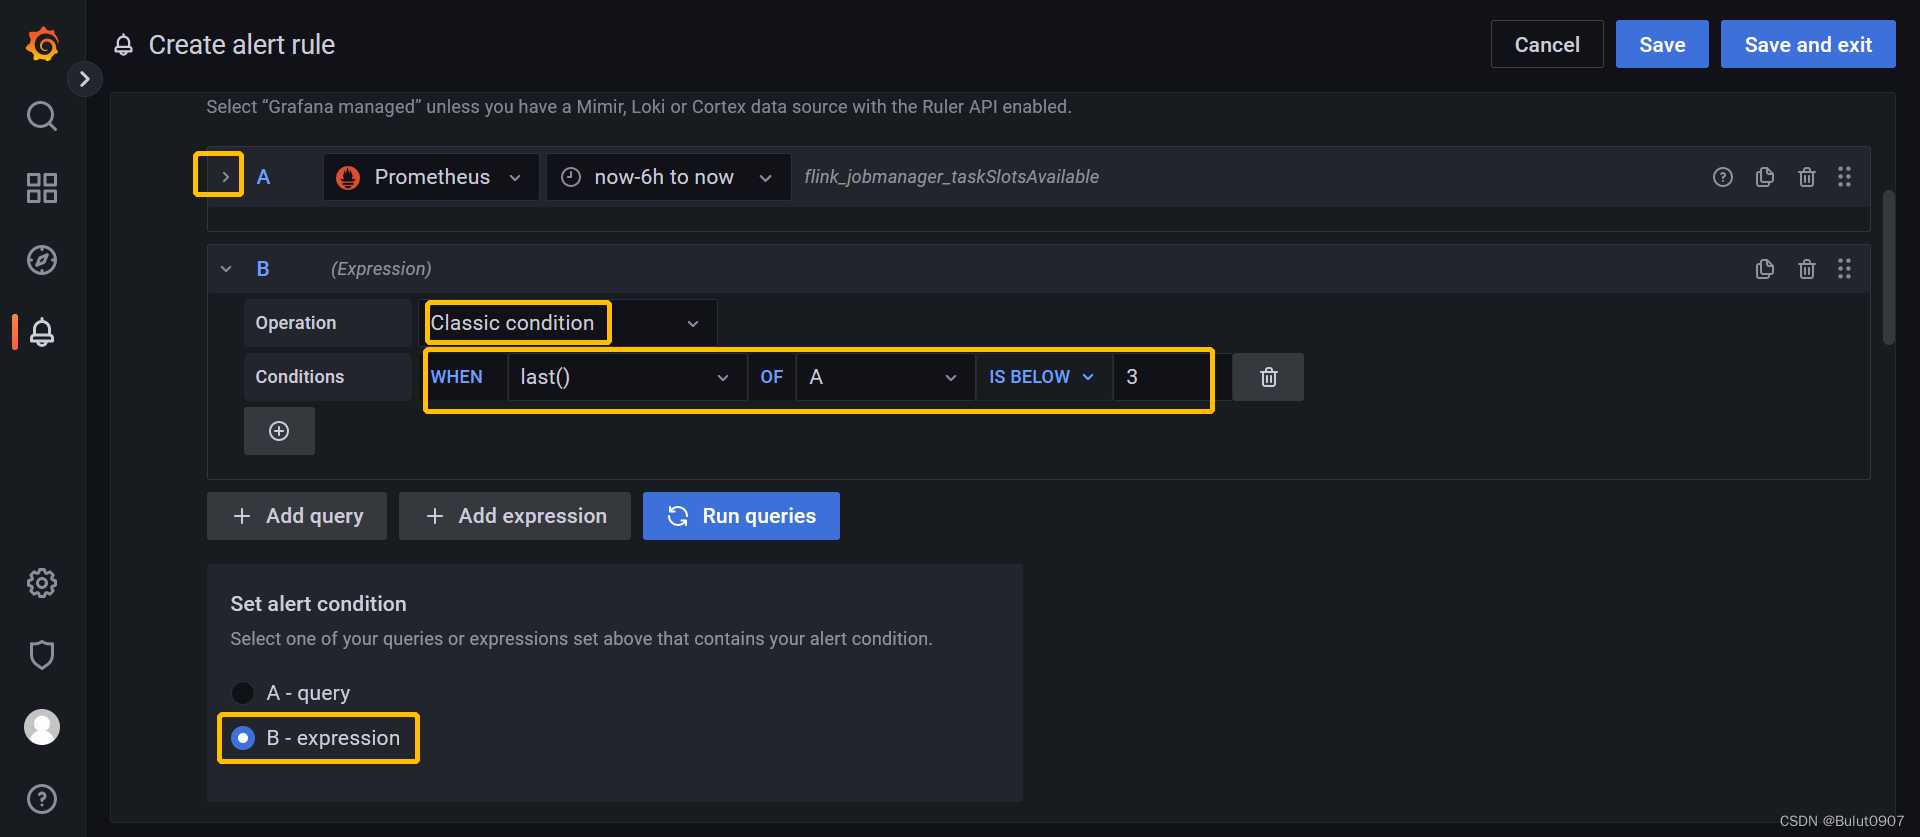 往下滑动,点击箭头将查询A折叠。定义报警条件,当最新的A查询的结果小于3时,就会报警
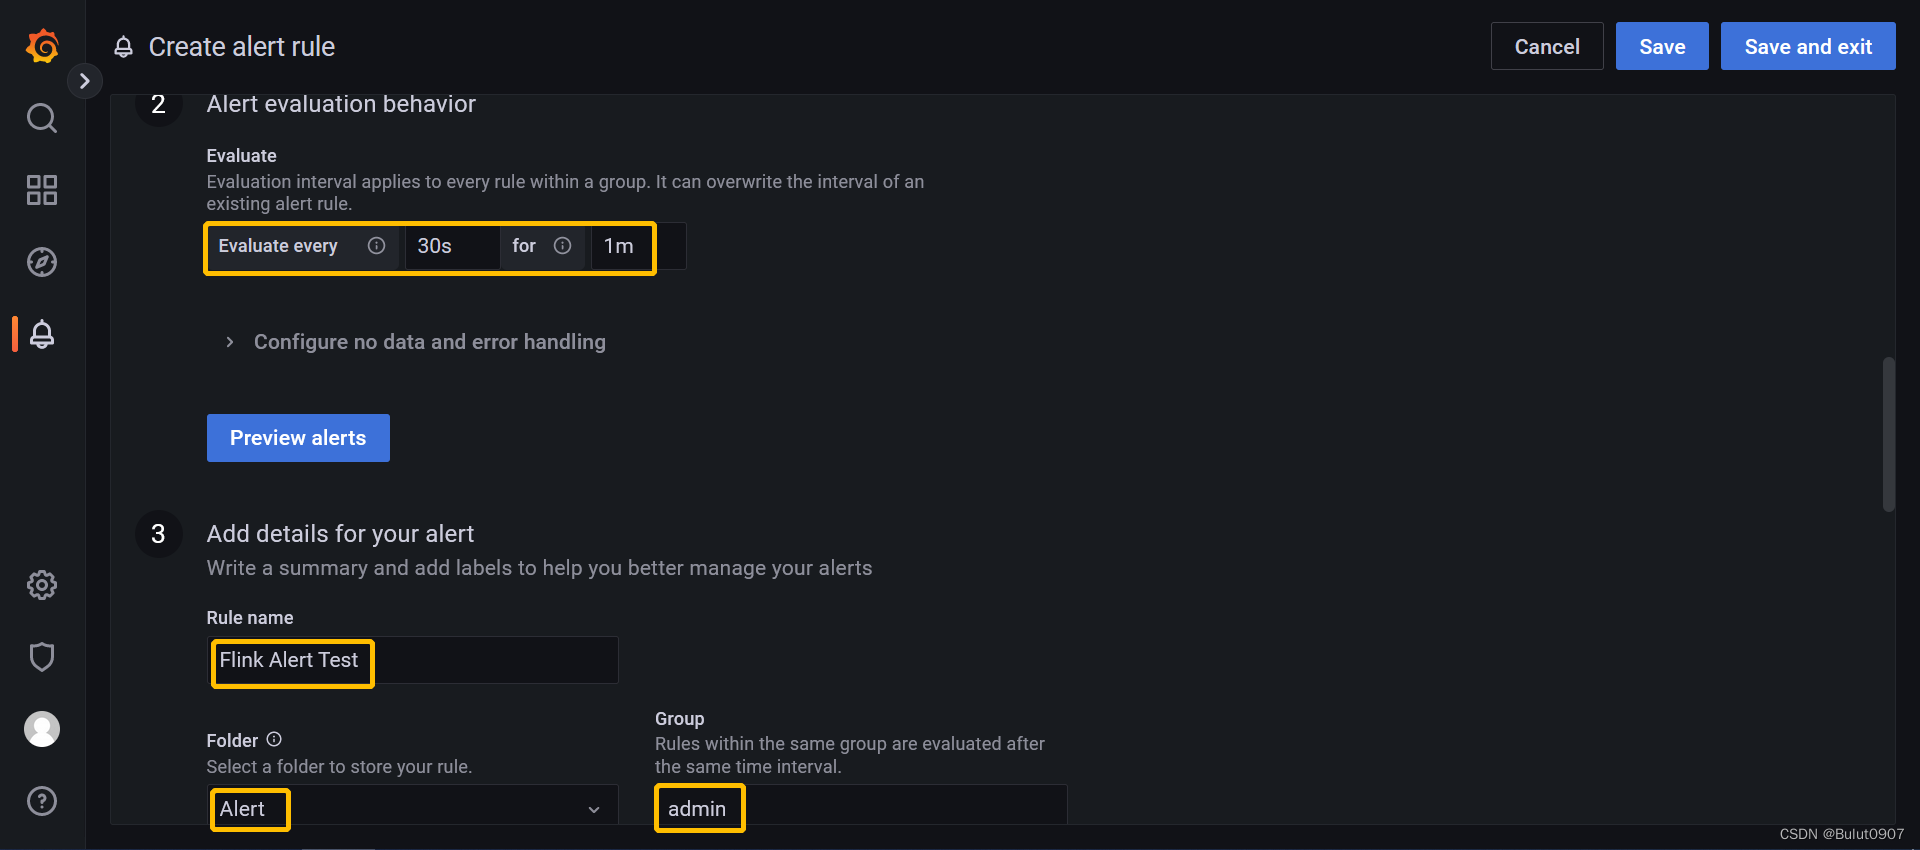 Alert evaluation behavior部分:每30秒进行一次规则检查,如果符合报警条件,延迟一分钟进行报警
Add details for your alert部分:定义Rule name,选择Alert Rule保存的文件夹。定义一个group,当该报警规则检查完后,该group下的所有规则都会被检查,我这里随便填写了一个不存在的group
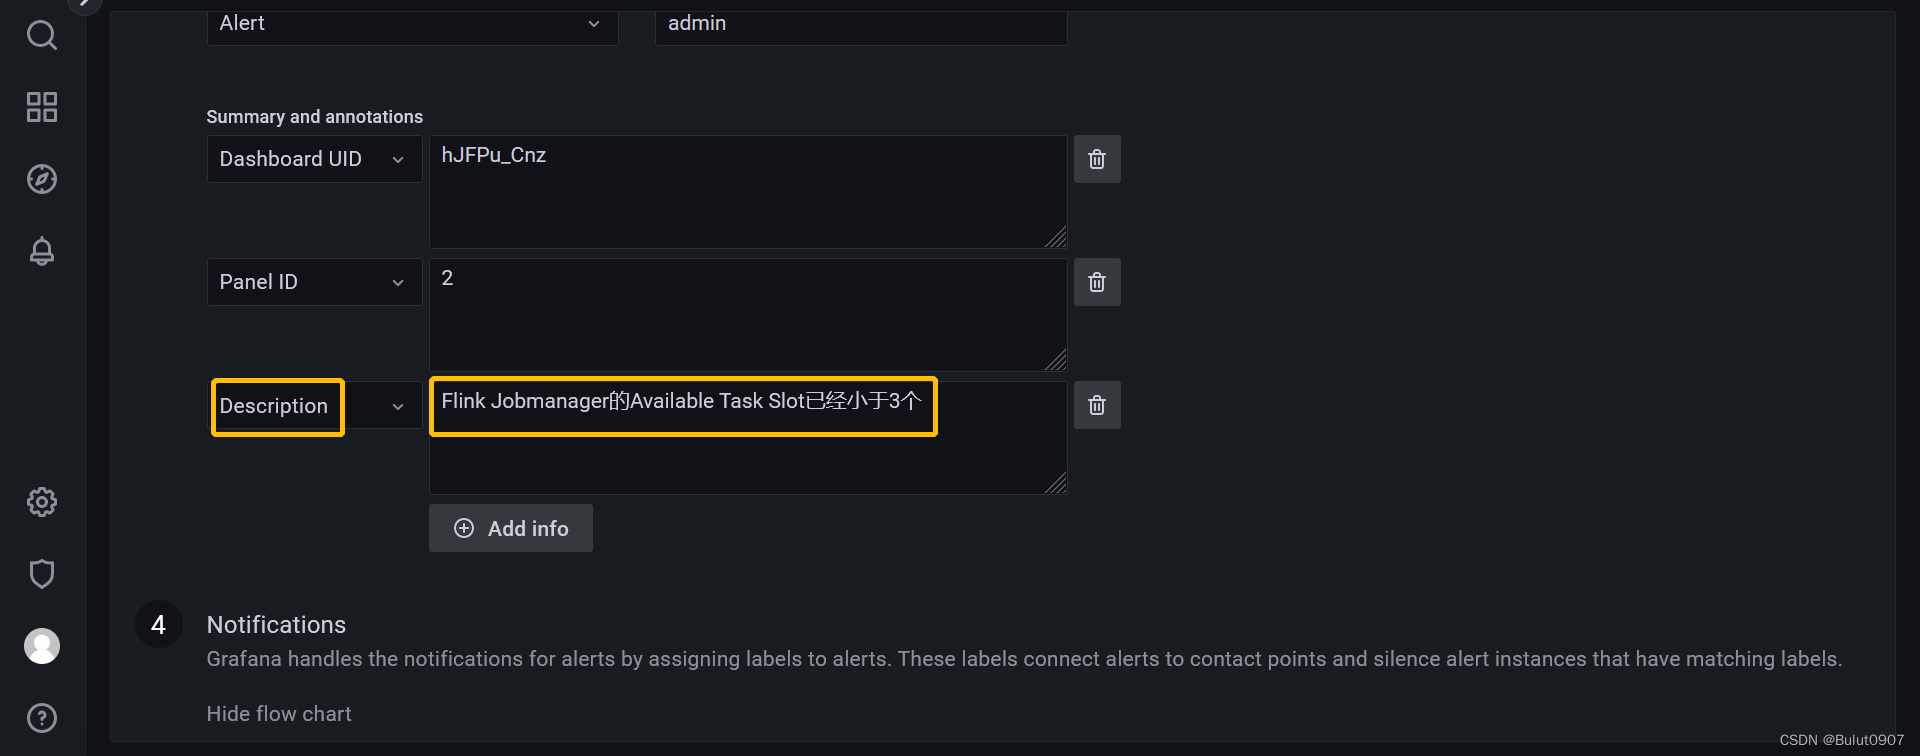 定义报警的Description,并输入描述内容
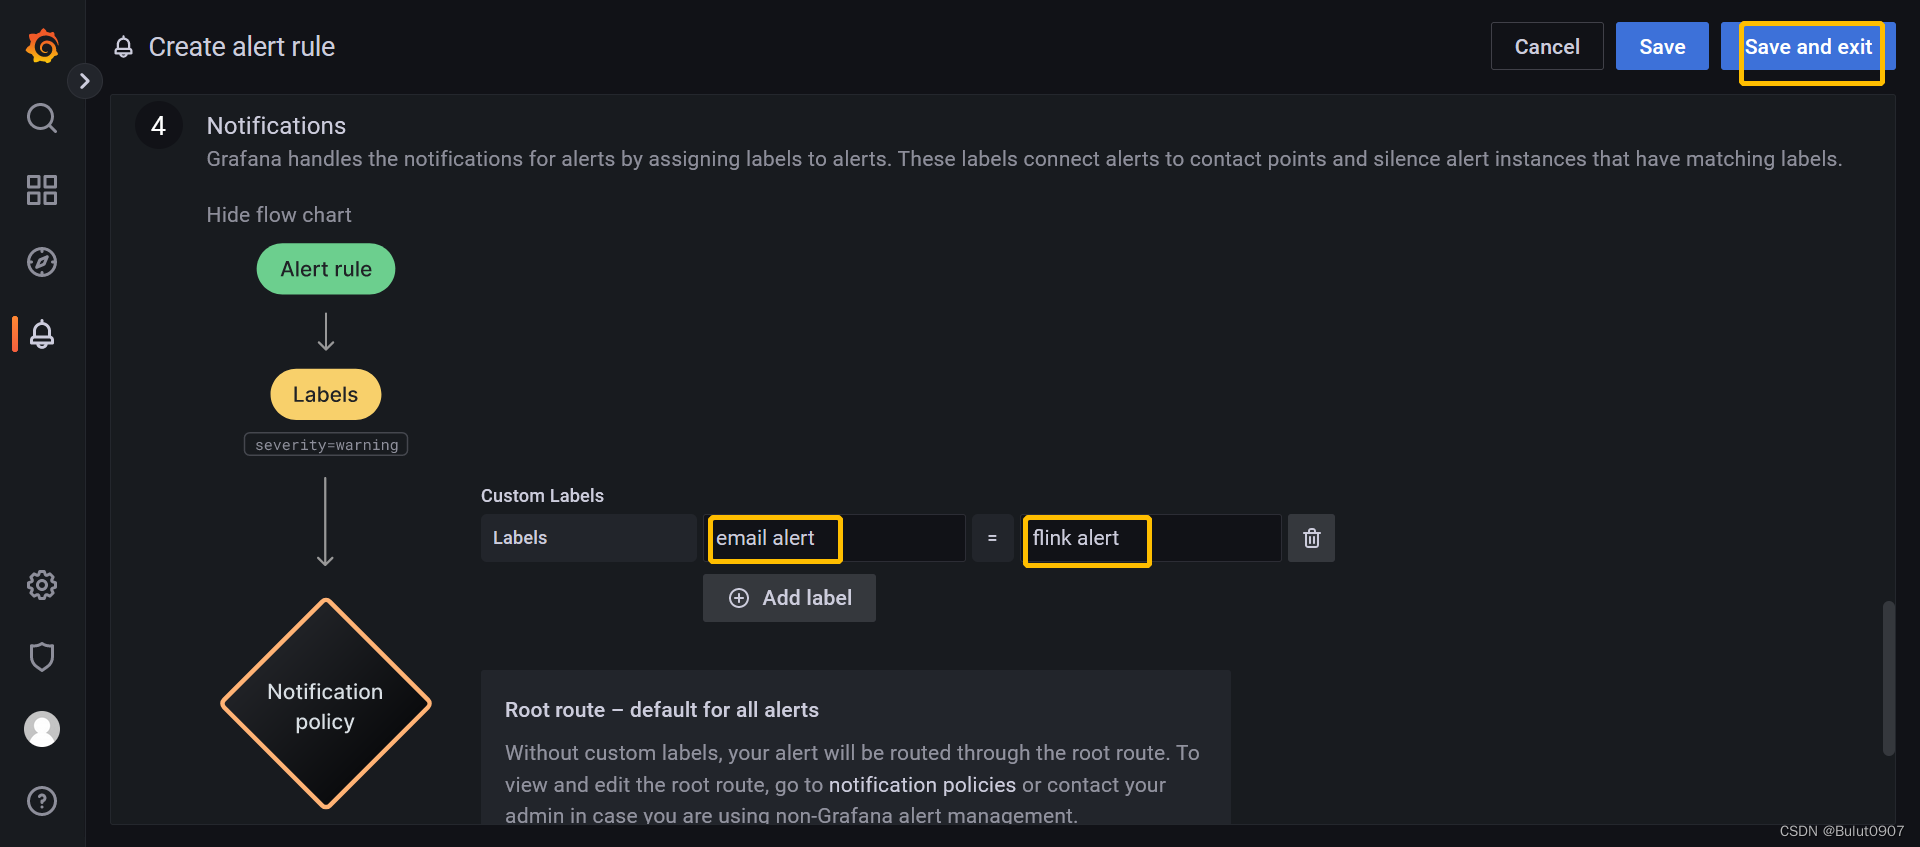 添加Notification policies中定义的label,然后点击【Save and exit】
7. Alert Rule测试
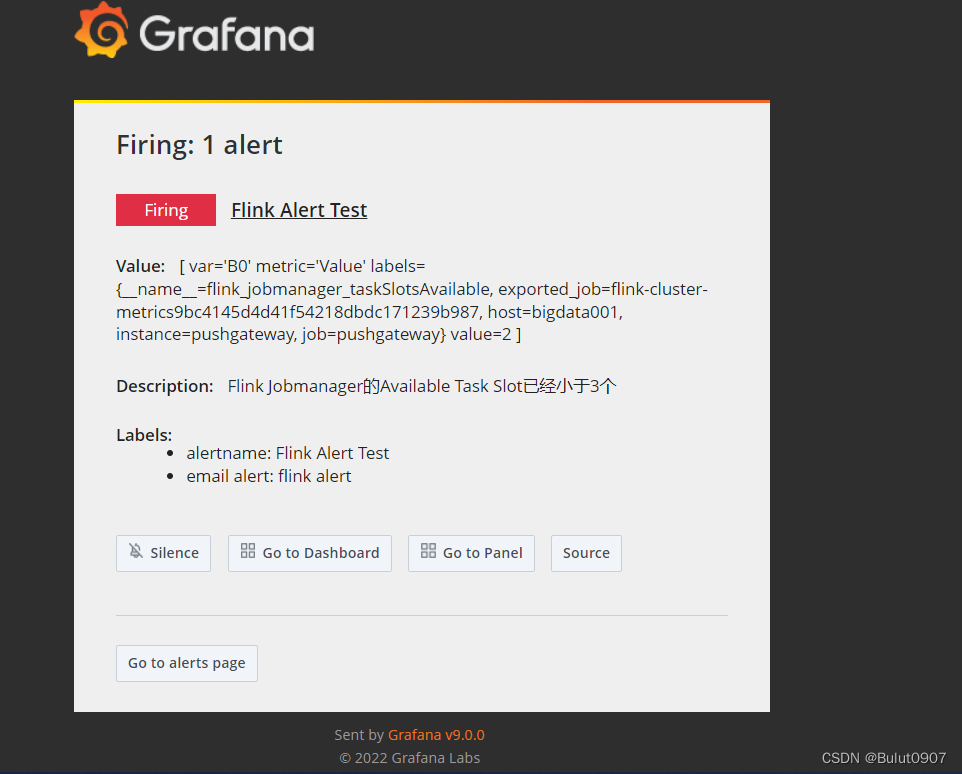
目前Flink集群有3个Available Task Slot,我们再启动一个Flink Application(占用一个slot)。这样Flink集群就只有2个Available Task Slot了,符合我们报警的规则。大概过了2分钟。就会收到报警邮件。邮件内容如下
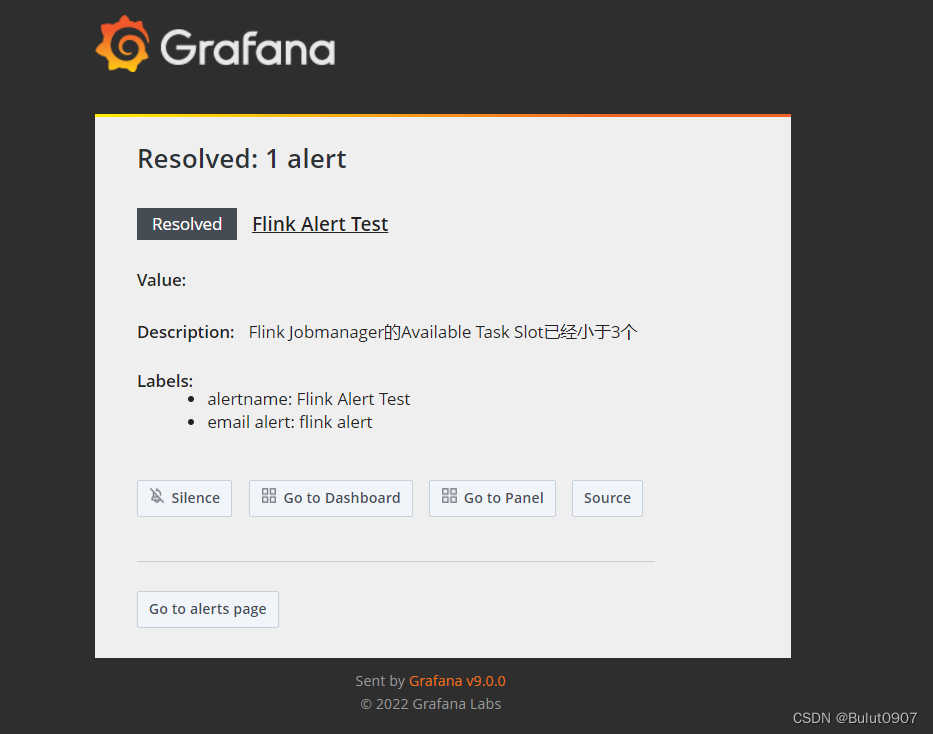
再将刚刚启动的那个Flink Application进行stop,Available Task Slot变成3个,不再符合Alert Rule。过大概15分钟,会收到问题已解决的邮件。邮件内容如下