1. 访问日志格式
格式规则:
访问日志格式包含提取相关数据并插入到格式指定处的命令运算符,目前支持两种格式:
	1. format strings 格式字符串
	1. format disctionaries 格式字典
命令操作符:
用于提取数据并插入到日志中
有些操作符对于TCP和HTTP来说含义有所不同
几个操作符示例
	- %REQ(X?Y):Z%  记录HTTP请求报文的指定标头(X)的值,Y是备用标头,Z是可选参数,表示字符串截断并保留最多Z个字符,X和Y标头均不保存在时记录为"-"; TCP不支持
	- %RESP(X?Y):Z% 记录HTTP响应报文的指标头的值;TCP不支持
- %DURATION%:
- HTTP 从开始时间到最后一个字符输出的请求的总持续时长(毫秒为单位)
- TCP 下游连接的总持续时长(毫秒为单位)
1.1 访问日志默认格式
[%START_TIME%] "%REQ(:METHOD)% %REQ(X-ENVOY-ORIGINAL-PATH?:PATH)% %PROTOCOL%"
%RESPONSE_CODE% %RESPONSE_FLAGS% %BYTES_RECEIVED% %BYTES_SENT% %DURATION%
%RESP(X-ENVOY-UPSTREAM-SERVICE-TIME)% "%REQ(X-FORWARDED-FOR)%" "%REQ(USER-AGENT)%"
"%REQ(X-REQUEST-ID)%" "%REQ(:AUTHORITY)%" "%UPSTREAM_HOST%"\n
参数含义:
| 参数 | 含义 |
|---|---|
| %START_TIME% | 请求开始的时间戳 |
| %REQ(X?Y):Z% | 请求报文中指定标头X的值,X不存在时则取标头Y的值相应值的会截取最多不超过Z个字符 |
| %RESP(X?Y):Z% | 功能类似于"%REQ(X?Y):Z%",但用于响应报文 |
| %PROTOCOL% | HTTP协议的版本,支持http/1.1、http/2和http/3TCP代理因不支持而显示为"-" |
| %RESPONSE_CODE% | HTTP响应码 TCP代理因不支持而显示为"-" |
| %RESPONSE_FLAGS% | 响应标志,用于进一步说明响应或连接的详细信息 |
| %BYTES_RECEIVED% | 接收的报文中body部分的大小TCP代理中意味着下游接收到的字节数 |
| %BYTES_SENT% | 发送的报文中body部分的大小TCP代理中意味着下游发送的字节数 |
| %DURATION% | 从接收到请求至发送完响应报文的最后一个字节所经历的时长对TCP代理来说是指下游连接的维持时长 |
| %UPSTREAM_HOST% | 上游的URL,TCP代理中格式为"tcp://ip:port" |
2. 日志定义案例1
2.1 docker-compose
4个Service:
- front-envoy:Front Proxy,地址为172.31.73.10
- 3个后端服务,仅是用于提供测试用的上游服务器
- service_blue
- service_red
- service_green
version: '3.3'

services:
  front-envoy:
    image: envoyproxy/envoy-alpine:v1.21.5
    environment:
      - ENVOY_UID=0
      - ENVOY_GID=0
    volumes:
    - ./front-envoy.yaml:/etc/envoy/envoy.yaml
    networks:
      envoymesh:
        ipv4_address: 172.31.73.10
        aliases:
        - front-envoy
    expose:
      # Expose ports 80 (for general traffic) and 9901 (for the admin server)
      - "80"
      - "9901"

  service_blue:
    image: ikubernetes/servicemesh-app:latest
    networks:
      envoymesh:
        aliases:
          - colored
          - blue
    environment:
      - SERVICE_NAME=blue
    expose:
      - "80"

  service_green:
    image: ikubernetes/servicemesh-app:latest
    networks:
      envoymesh:
        aliases:
          - colored
          - green
    environment:
      - SERVICE_NAME=green
    expose:
      - "80"

  service_red:
    image: ikubernetes/servicemesh-app:latest
    networks:
      envoymesh:
        aliases:
          - colored
          - red
    environment:
      - SERVICE_NAME=red
    expose:
      - "80"

networks:
  envoymesh:
    driver: bridge
    ipam:
      config:
        - subnet: 172.31.73.0/24
2.2 envoy.yaml
将日志以json格式打印
node:
  id: front-envoy
  cluster: mycluster

admin:
  profile_path: /tmp/envoy.prof
  access_log_path: /tmp/admin_access.log
  address:
    socket_address:
       address: 0.0.0.0
       port_value: 9901

layered_runtime:
  layers:
  - name: admin
    admin_layer: {

    }

static_resources:
  listeners:
  - address:
      socket_address:
        address: 0.0.0.0
        port_value: 80
    name: listener_http
    filter_chains:
    - filters:
      - name: envoy.filters.network.http_connection_manager
        typed_config:
          "@type": type.googleapis.com/envoy.extensions.filters.network.http_connection_manager.v3.HttpConnectionManager
          stat_prefix: ingress_http
          codec_type: AUTO
          access_log:
          - name: envoy.access_loggers.file
            typed_config:
              "@type": type.googleapis.com/envoy.extensions.access_loggers.file.v3.FileAccessLog
              path: "/dev/stdout"
              log_format:
                json_format: {

    "start": "[%START_TIME%] ", "method": "%REQ(:METHOD)%", "url": "%REQ(X-ENVOY-ORIGINAL-PATH?:PATH)%", "protocol": "%PROTOCOL%", "status": "%RESPONSE_CODE%", "respflags": "%RESPONSE_FLAGS%", "bytes-received": "%BYTES_RECEIVED%", "bytes-sent": "%BYTES_SENT%", "duration": "%DURATION%", "upstream-service-time": "%RESP(X-ENVOY-UPSTREAM-SERVICE-TIME)%", "x-forwarded-for": "%REQ(X-FORWARDED-FOR)%", "user-agent": "%REQ(USER-AGENT)%", "request-id": "%REQ(X-REQUEST-ID)%", "authority": "%REQ(:AUTHORITY)%", "upstream-host": "%UPSTREAM_HOST%", "remote-ip": "%DOWNSTREAM_REMOTE_ADDRESS_WITHOUT_PORT%"}
                #text_format: "[%START_TIME%] \"%REQ(:METHOD)% %REQ(X-ENVOY-ORIGINAL-PATH?:PATH)% %PROTOCOL%\" %RESPONSE_CODE% %RESPONSE_FLAGS% %BYTES_RECEIVED% %BYTES_SENT% %DURATION% %RESP(X-ENVOY-UPSTREAM-SERVICE-TIME)% \"%REQ(X-FORWARDED-FOR)%\" \"%REQ(USER-AGENT)%\" \"%REQ(X-REQUEST-ID)%\" \"%REQ(:AUTHORITY)%\" \"%UPSTREAM_HOST%\" \"%DOWNSTREAM_REMOTE_ADDRESS_WITHOUT_PORT%\"\n"
          stat_prefix: ingress_http
          route_config:
            name: local_route
            virtual_hosts:
            - name: vh_001
              domains: ["*"]
              routes:
              - match:
                  prefix: "/"
                route:
                  cluster: mycluster
          http_filters:
          - name: envoy.filters.http.router

  clusters:
  - name: mycluster
    connect_timeout: 0.25s
    type: STRICT_DNS
    lb_policy: ROUND_ROBIN
    load_assignment:
      cluster_name: mycluster
      endpoints:
      - lb_endpoints:
        - endpoint:
            address:
              socket_address:
                address: colo
2.3 测试
向front envoy发起访问
# curl 172.31.73.10/service/colors
Hello from App behind Envoy (service red)! hostname: 40c4f697eb7e resolved hostname: 172.31.73.2
# curl 172.31.73.10/service/colors
Hello from App behind Envoy (service green)! hostname: e10b7cf3c1df resolved hostname: 172.31.73.3
# curl 172.31.73.10/service/colors
Hello from App behind Envoy (service red)! hostname: 40c4f697eb7e resolved hostname: 172.31.73.2
日志被打印到前端
service_red_1    | 127.0.0.1 - - [09/Oct/2022 04:39:02] "GET /service/colors HTTP/1.1" 200 -
front-envoy_1    | {

    "start":"[2022-10-09T04:39:02.624Z] ","remote-ip":"172.31.73.1","respflags":"-","method":"GET","x-forwarded-for":null,"bytes-received":0,"protocol":"HTTP/1.1","url":"/service/colors","upstream-host":"172.31.73.2:80","duration":2,"bytes-sent":97,"user-agent":"curl/7.58.0","authority":"172.31.73.10","request-id":"4d2fe998-1263-49c6-82d8-588abd385a84","upstream-service-time":"2","status":200}
service_green_1  | 127.0.0.1 - - [09/Oct/2022 04:39:05] "GET /service/colors HTTP/1.1" 200 -
service_red_1    | 127.0.0.1 - - [09/Oct/2022 04:39:07] "GET /service/colors HTTP/1.1" 200 -
front-envoy_1    | {

    "respflags":"-","protocol":"HTTP/1.1","user-agent":"curl/7.58.0","bytes-received":0,"method":"GET","request-id":"c98840d5-0efe-4f41-924c-1ca37321df05","authority":"172.31.73.10","bytes-sent":99,"url":"/service/colors","duration":3,"remote-ip":"172.31.73.1","status":200,"start":"[2022-10-09T04:39:05.375Z] ","x-forwarded-for":null,"upstream-host":"172.31.73.3:80","upstream-service-time":"3"}
front-envoy_1    | {

    "start":"[2022-10-09T04:39:07.887Z] ","x-forwarded-for":null,"method":"GET","respflags":"-","bytes-sent":97,"request-id":"0094c6cb-3f15-4337-b6d2-ad3d3ab21474","status":200,"authority":"172.31.73.10","user-agent":"curl/7.58.0","protocol":"HTTP/1.1","upstream-host":"172.31.73.2:80","url":"/service/colors","bytes-received":0,"duration":1,"remote-ip":"172.31.73.1","upstream-service-time":"1"}
结束掉docker-compose将日志格式设置为text,再次访问后日志以下列格式输出
front-envoy_1    | [2022-10-09T04:43:27.176Z] "GET /service/colors HTTP/1.1" 200 - 0 98 5 5 "-" "curl/7.58.0" "2f8bbce7-1c29-4c17-8ccf-15f3f448dd45" "172.31.73.10" "172.31.73.4:80" "172.31.73.1"
service_green_1  | 127.0.0.1 - - [09/Oct/2022 04:43:28] "GET /service/colors HTTP/1.1" 200 -
service_green_1  | 127.0.0.1 - - [09/Oct/2022 04:43:29] "GET /service/colors HTTP/1.1" 200 -
front-envoy_1    | [2022-10-09T04:43:28.135Z] "GET /service/colors HTTP/1.1" 200 - 0 99 2 2 "-" "curl/7.58.0" "19411474-04b1-4e1f-87aa-2b13787c7ba3" "172.31.73.10" "172.31.73.3:80" "172.31.73.1"
front-envoy_1    | [2022-10-09T04:43:29.223Z] "GET /service/colors HTTP/1.1" 200 - 0 99 2 1 "-" "curl/7.58.0" "62dfdb0b-d2aa-41e8-94ba-7b7915946cb5" "172.31.73.10" "172.31.73.3:80" "172.31.73.1"
service_blue_1   | 127.0.0.1 - - [09/Oct/2022 04:43:30] "GET /service/colors HTTP/1.1" 200 -
front-envoy_1    | [2022-10-09T04:43:30.294Z] "GET /service/colors HTTP/1.1" 200 - 0 98 1 1 "-" "curl/7.58.0" "4f23c598-0f96-4355-8820-f26230cba73f" "172.31.73.10" "172.31.73.4:80" "172.31.73.1"
3. 日志收集efk案例
3.1 docker-compose
7个Service:
- front-envoy:Front Proxy,地址为172.31.76.10
- 3个后端服务,仅是用于提供测试用的上游服务器
- service_blue
- service_red
- service_green
- 三个日志服务
- elasticsearch,地址为172.31.76.15,绑定宿主机的9200端口
- kibana,地址为172.31.76.16,绑定宿主机的5601端口
- filebeat
version: '3.3'

services:
  front-envoy:
    image: envoyproxy/envoy-alpine:v1.21.5
    environment:
      - ENVOY_UID=0
      - ENVOY_GID=0
    container_name: front-envoy
    volumes:
    - ./front-envoy.yaml:/etc/envoy/envoy.yaml
    - ./logs/envoy:/logs/envoy
    networks:
      envoymesh:
        ipv4_address: 172.31.76.10
        aliases:
        - front-envoy
    expose:
      # Expose ports 80 (for general traffic) and 9901 (for the admin server)
      - "80"
      - "9901"

  service_blue:
    image: ikubernetes/servicemesh-app:latest
    networks:
      envoymesh:
        aliases:
          - colored
          - blue
    environment:
      - SERVICE_NAME=blue
    expose:
      - "80"

  service_green:
    image: ikubernetes/servicemesh-app:latest
    networks:
      envoymesh:
        aliases:
          - colored
          - green
    environment:
      - SERVICE_NAME=green
    expose:
      - "80"

  service_red:
    image: ikubernetes/servicemesh-app:latest
    networks:
      envoymesh:
        aliases:
          - colored
          - red
    environment:
      - SERVICE_NAME=red
    expose:
      - "80"

  elasticsearch:
    image: "docker.elastic.co/elasticsearch/elasticsearch:7.14.2"
    environment:
    - "ES_JAVA_OPTS=-Xms1g -Xmx1g"
    - "discovery.type=single-node"
    - "cluster.name=myes"
    - "node.name=myes01"
    ulimits:
      memlock:
        soft: -1
        hard: -1
    networks:
      envoymesh:
        ipv4_address: 172.31.76.15
        aliases:
        - es
        - myes01
    ports:
    - "9200:9200"
    volumes:
    - elasticsearch_data:/usr/share/elasticsearch/data

  kibana:
    image: "docker.elastic.co/kibana/kibana:7.14.2"
    environment:
      ELASTICSEARCH_URL: http://myes01:9200
      ELASTICSEARCH_HOSTS: '["http://myes01:9200"]'
    networks:
      envoymesh:
        ipv4_address: 172.31.76.16
        aliases:
          - kibana
          - kib
    ports:
    - "5601:5601"

  filebeat:
    image: "harbor.intra.com/baseimages/filebeat:7.14.2"
    networks:
      envoymesh:
        ipv4_address: 172.31.76.17
        aliases:
          - filebeat
          - fb
    user: root
    command: ["--strict.perms=false"]
    volumes:
    - ./filebeat/filebeat.yaml:/usr/share/filebeat/filebeat.yml
      #- /var/lib/docker:/var/lib/docker:ro
      #- /var/run/docker.sock:/var/run/docker.sock
    - ./logs/envoy:/logs/envoy:ro

volumes:
    elasticsearch_data:

networks:
  envoymesh:
    driver: bridge
    ipam:
      config:
        - subnet: 172.31.76.0/24
3.2 envoy.yaml
以json格式存储front envoy的日志
node:
  id: front-envoy
  cluster: mycluster

admin:
  profile_path: /tmp/envoy.prof
  access_log_path: /tmp/admin_access.log
  address:
    socket_address:
       address: 0.0.0.0
       port_value: 9901

layered_runtime:
  layers:
  - name: admin
    admin_layer: {

    }

static_resources:
  listeners:
  - address:
      socket_address:
        address: 0.0.0.0
        port_value: 80
    name: listener_http
    filter_chains:
    - filters:
      - name: envoy.filters.network.http_connection_manager
        typed_config:
          "@type": type.googleapis.com/envoy.extensions.filters.network.http_connection_manager.v3.HttpConnectionManager
          stat_prefix: ingress_http
          codec_type: AUTO
          access_log:
          - name: envoy.access_loggers.file
            typed_config:
              "@type": type.googleapis.com/envoy.extensions.access_loggers.file.v3.FileAccessLog
              path: "/logs/envoy/front-envoy-access.log"
              log_format:
                json_format: {

    "start": "[%START_TIME%] ", "method": "%REQ(:METHOD)%", "url": "%REQ(X-ENVOY-ORIGINAL-PATH?:PATH)%", "protocol": "%PROTOCOL%", "status": "%RESPONSE_CODE%", "respflags": "%RESPONSE_FLAGS%", "bytes-received": "%BYTES_RECEIVED%", "bytes-sent": "%BYTES_SENT%", "duration": "%DURATION%", "upstream-service-time": "%RESP(X-ENVOY-UPSTREAM-SERVICE-TIME)%", "x-forwarded-for": "%REQ(X-FORWARDED-FOR)%", "user-agent": "%REQ(USER-AGENT)%", "request-id": "%REQ(X-REQUEST-ID)%", "authority": "%REQ(:AUTHORITY)%", "upstream-host": "%UPSTREAM_HOST%", "remote-ip": "%DOWNSTREAM_REMOTE_ADDRESS_WITHOUT_PORT%"}
                #text_format: "[%START_TIME%] \"%REQ(:METHOD)% %REQ(X-ENVOY-ORIGINAL-PATH?:PATH)% %PROTOCOL%\" %RESPONSE_CODE% %RESPONSE_FLAGS% %BYTES_RECEIVED% %BYTES_SENT% %DURATION% %RESP(X-ENVOY-UPSTREAM-SERVICE-TIME)% \"%REQ(X-FORWARDED-FOR)%\" \"%REQ(USER-AGENT)%\" \"%REQ(X-REQUEST-ID)%\" \"%REQ(:AUTHORITY)%\" \"%UPSTREAM_HOST%\" \"%DOWNSTREAM_REMOTE_ADDRESS_WITHOUT_PORT%\"\n"
          stat_prefix: ingress_http
          route_config:
            name: local_route
            virtual_hosts:
            - name: vh_001
              domains: ["*"]
              routes:
              - match:
                  prefix: "/"
                route:
                  cluster: mycluster
          http_filters:
          - name: envoy.filters.http.router

  clusters:
  - name: mycluster
    connect_timeout: 0.25s
    type: STRICT_DNS
    lb_policy: ROUND_ROBIN
    load_assignment:
      cluster_name: mycluster
      endpoints:
      - lb_endpoints:
        - endpoint:
            address:
              socket_address:
                address: colored
                port_value: 80
3.3 filebeat.yaml
通过两个容器挂载通一个卷,实现access.log读取
以filebeat-格式存储日志.
filebeat.inputs:
- type: log
  paths:
    - '/logs/envoy/*access.log'

processors:
- decode_json_fields:
    fields: ["message"]
    target: ""
    overwrite_keys: true

output.elasticsearch:
  hosts: ["http://elasticsearch:9200"]
  indices:
    - index: "filebeat-%{+yyyy.MM.dd}"
#    - index: "filebeat-%{[agent.version]}-%{+yyyy.MM.dd}"

#output.console:
#  enabled: true
#  codec.json:
#    pretty: true
#    #escape_html: false

logging.json: true
logging.metrics.enabled: false
3.3 测试
3.3.1 生成访问日志
持续对172.31.76.10/service/colors进行访问使得不断产生访问日志
# while true; do curl 172.31.76.10/service/colors; sleep 0.$RANDOM; done
Hello from App behind Envoy (service green)! hostname: d595b6bc68f2 resolved hostname: 172.31.76.2
Hello from App behind Envoy (service red)! hostname: b4455dfe8c60 resolved hostname: 172.31.76.4
Hello from App behind Envoy (service blue)! hostname: 0a92c97553bb resolved hostname: 172.31.76.3
Hello from App behind Envoy (service green)! hostname: d595b6bc68f2 resolved hostname: 172.31.76.2
Hello from App behind Envoy (service red)! hostname: b4455dfe8c60 resolved hostname: 172.31.76.4
Hello from App behind Envoy (service blue)! hostname: 0a92c97553bb resolved hostname: 172.31.76.3
Hello from App behind Envoy (service blue)! hostname: 0a92c97553bb resolved hostname: 172.31.76.3
Hello from App behind Envoy (service red)! hostname: b4455dfe8c60 resolved hostname: 172.31.76.4
Hello from App behind Envoy (service green)! hostname: d595b6bc68f2 resolved hostname: 172.31.76.2
Hello from App behind Envoy (service green)! hostname: d595b6bc68f2 resolved hostname: 172.31.76.2
Hello from App behind Envoy (service red)! hostname: b4455dfe8c60 resolved hostname: 172.31.76.4
Hello from App behind Envoy (service blue)! hostname: 0a92c97553bb resolved hostname: 172.31.76.3
Hello from App behind Envoy (service blue)! hostname: 0a92c97553bb resolved hostname: 172.31.76.3
## front envoy前端
service_blue_1   | 127.0.0.1 - - [09/Oct/2022 05:38:30] "GET /service/colors HTTP/1.1" 200 -
service_green_1  | 127.0.0.1 - - [09/Oct/2022 05:38:30] "GET /service/colors HTTP/1.1" 200 -
service_blue_1   | 127.0.0.1 - - [09/Oct/2022 05:38:30] "GET /service/colors HTTP/1.1" 200 -
service_green_1  | [2022-10-09 05:38:31.148][8][info][main] [source/server/drain_manager_impl.cc:171] shutting down parent after drain
service_red_1    | 127.0.0.1 - - [09/Oct/2022 05:38:31] "GET /service/colors HTTP/1.1" 200 -
service_green_1  | 127.0.0.1 - - [09/Oct/2022 05:38:31] "GET /service/colors HTTP/1.1" 200 -
service_blue_1   | [2022-10-09 05:38:31.540][8][info][main] [source/server/drain_manager_impl.cc:171] shutting down parent after drain
service_red_1    | 127.0.0.1 - - [09/Oct/2022 05:38:32] "GET /service/colors HTTP/1.1" 200 -
service_red_1    | [2022-10-09 05:38:32.564][10][info][main] [source/server/drain_manager_impl.cc:171] shutting down parent after drain
front-envoy      | [2022-10-09 05:38:33.214][1][info][main] [source/server/drain_manager_impl.cc:171] shutting down parent after drain
service_blue_1   | 127.0.0.1 - - [09/Oct/2022 05:38:33] "GET /service/colors HTTP/1.1" 200 -
service_green_1  | 127.0.0.1 - - [09/Oct/2022 05:38:33] "GET /service/colors HTTP/1.1" 200 -
service_green_1  | 127.0.0.1 - - [09/Oct/2022 05:38:33] "GET /service/colors HTTP/1.1" 200 -
访问本机的9200可以看到es已经正常工作
# curl 192.168.31.111:9200
{


  "name" : "myes01",
  "cluster_name" : "myes",
  "cluster_uuid" : "-YUl6c61RtWjCEjZPcD7ww",
  "version" : {


    "number" : "7.14.2",
    "build_flavor" : "default",
    "build_type" : "docker",
    "build_hash" : "6bc13727ce758c0e943c3c21653b3da82f627f75",
    "build_date" : "2021-09-15T10:18:09.722761972Z",
    "build_snapshot" : false,
    "lucene_version" : "8.9.0",
    "minimum_wire_compatibility_version" : "6.8.0",
    "minimum_index_compatibility_version" : "6.0.0-beta1"
  },
  "tagline" : "You Know, for Search"
}
查看cat接口可以看到索引都正常产生
# curl 192.168.31.111:9200/_cat/indices
green  open .geoip_databases                  74Ehk17JQdOu1Q-h_HQZ2A 1 0  40   0  38.4mb  38.4mb
green  open .apm-custom-link                  N62bcvTpSSuq0yD0pv7k8w 1 0   0   0    208b    208b
green  open .kibana_task_manager_7.14.2_001   t_3L-LxFRGKoJ8WuFZmXXg 1 0  14 939 154.8kb 154.8kb
green  open .apm-agent-configuration          iLGSkKURRwWjG8YSmRfDjA 1 0   0   0    208b    208b
green  open .kibana_7.14.2_001                zSz0oa2pQL6ZcSgsDlzp0A 1 0  24  24   2.3mb   2.3mb
yellow open filebeat-7.14.2-2022.10.09-000001 BKIdOIkaQIKIRmZ8Dp0GmQ 1 1   0   0    208b    208b
yellow open filebeat-2022.10.09               vHJM8z-BRouO4kaZrhjVjw 1 1 846   0   1.6mb   1.6mb
green  open .kibana-event-log-7.14.2-000001   9ykWFEB2Rv267UZxTovh8Q 1 0   1   0   5.6kb   5.6kb
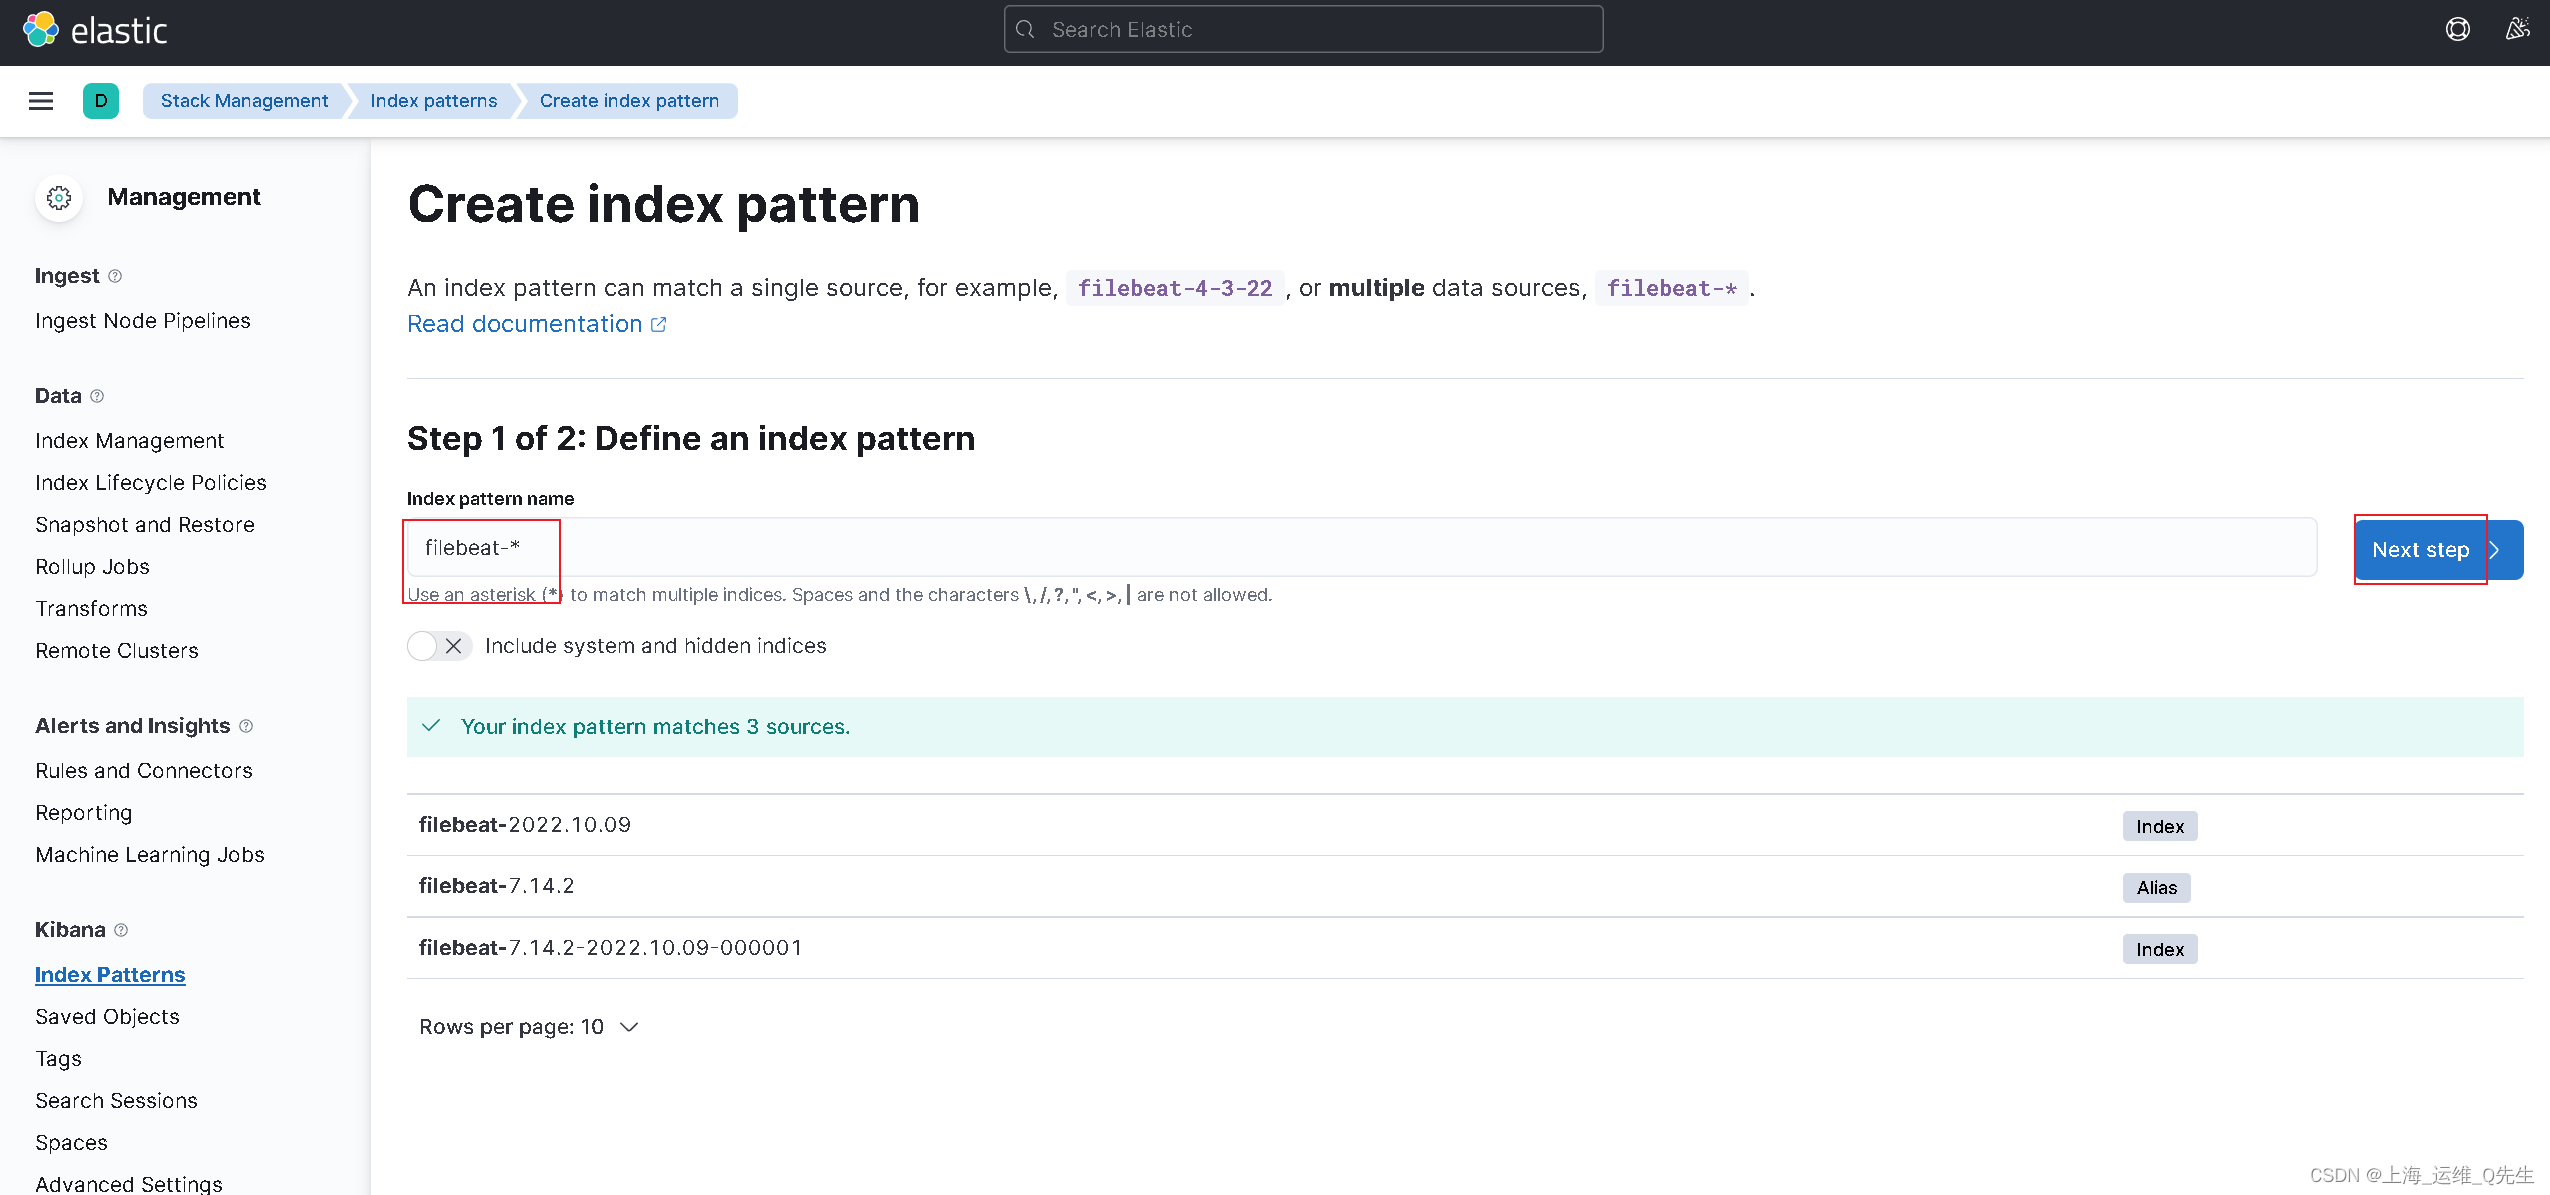
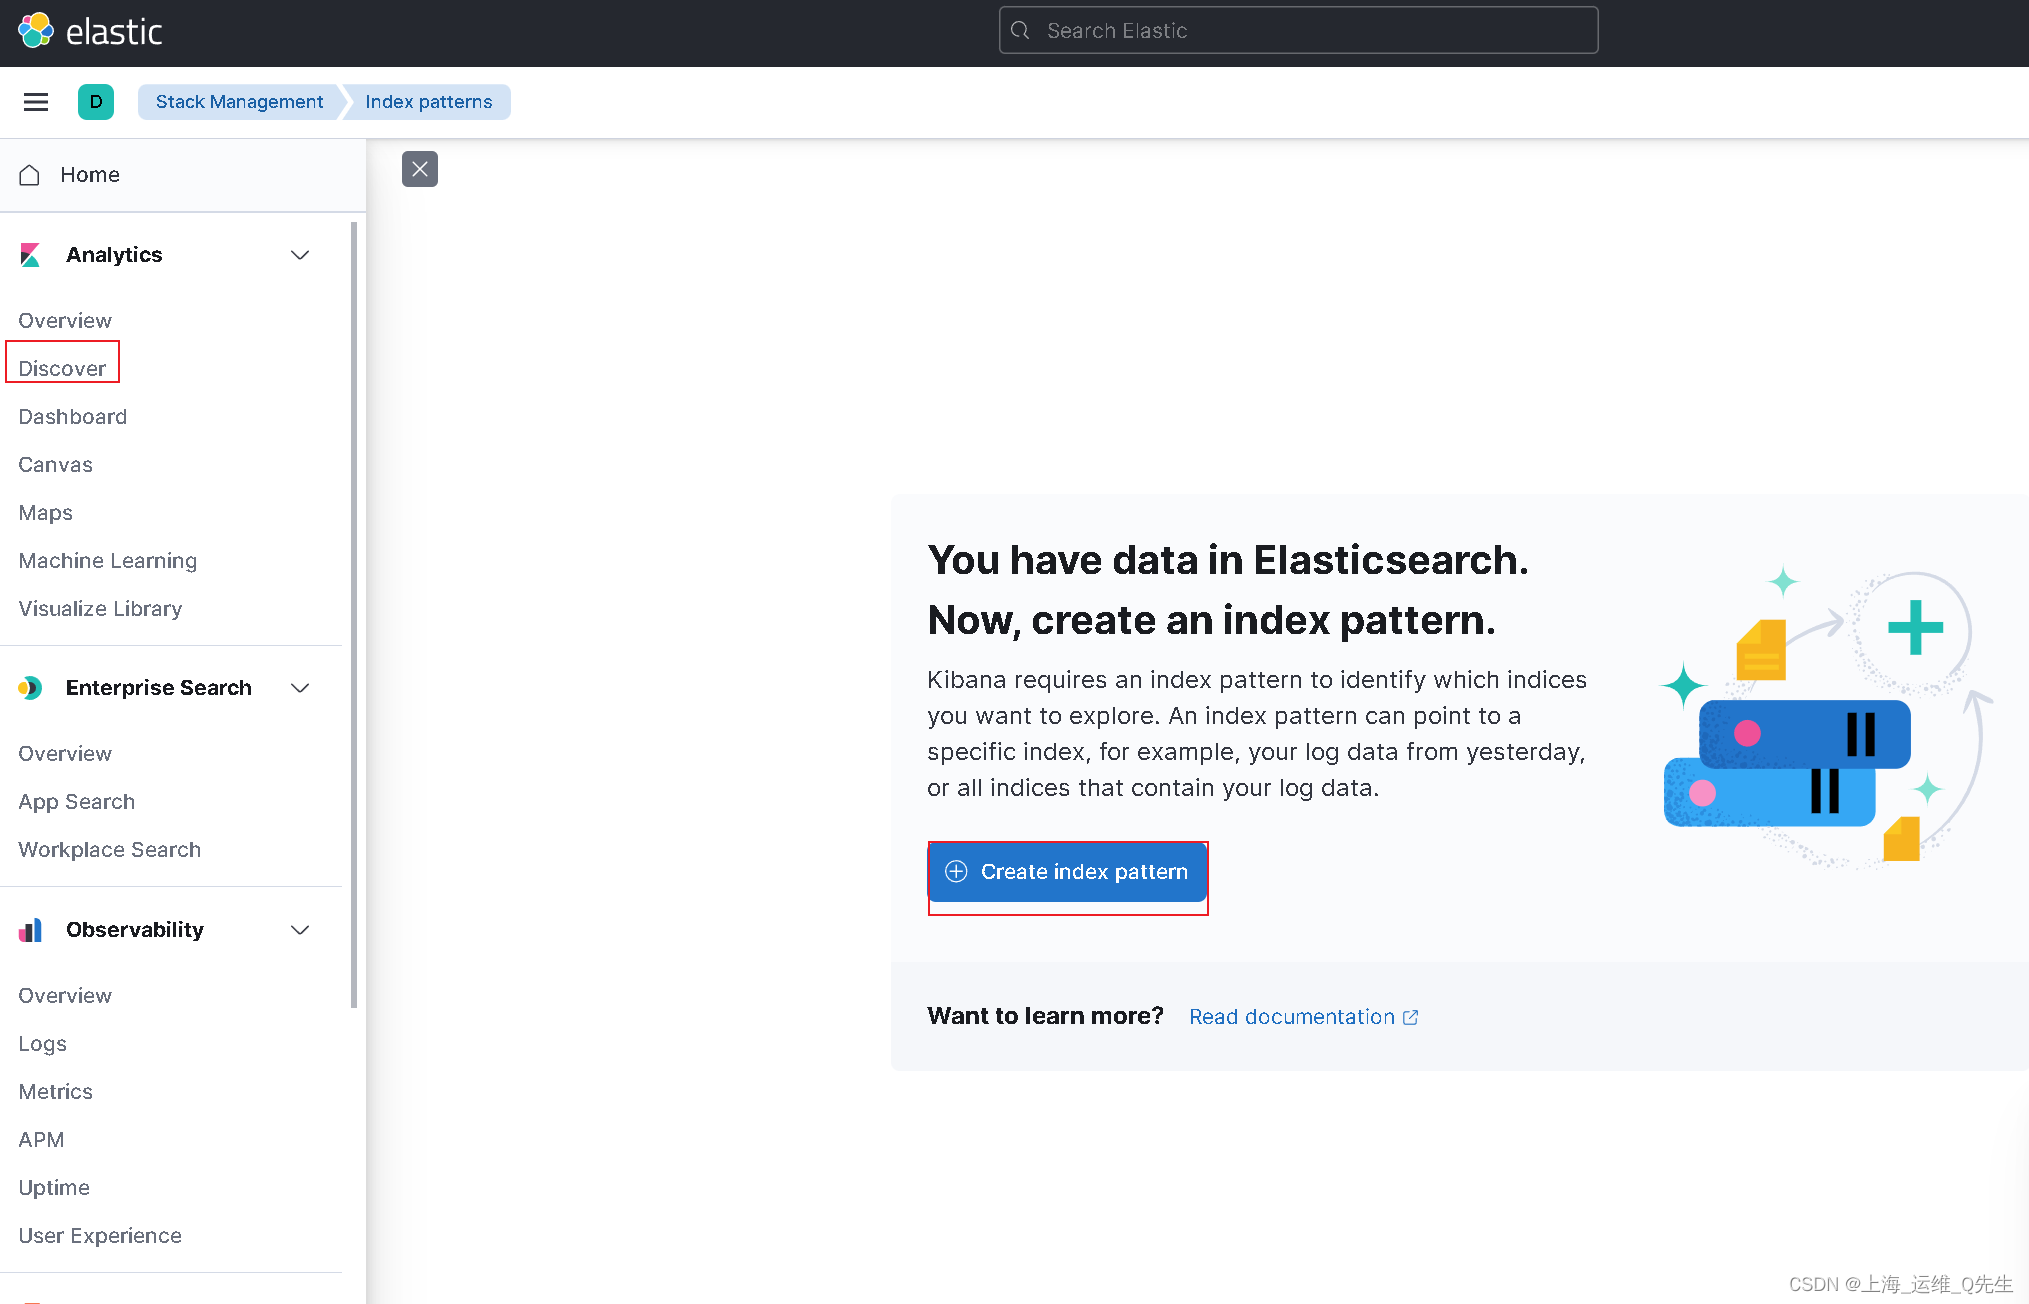
3.3.2 Kibana数据接入
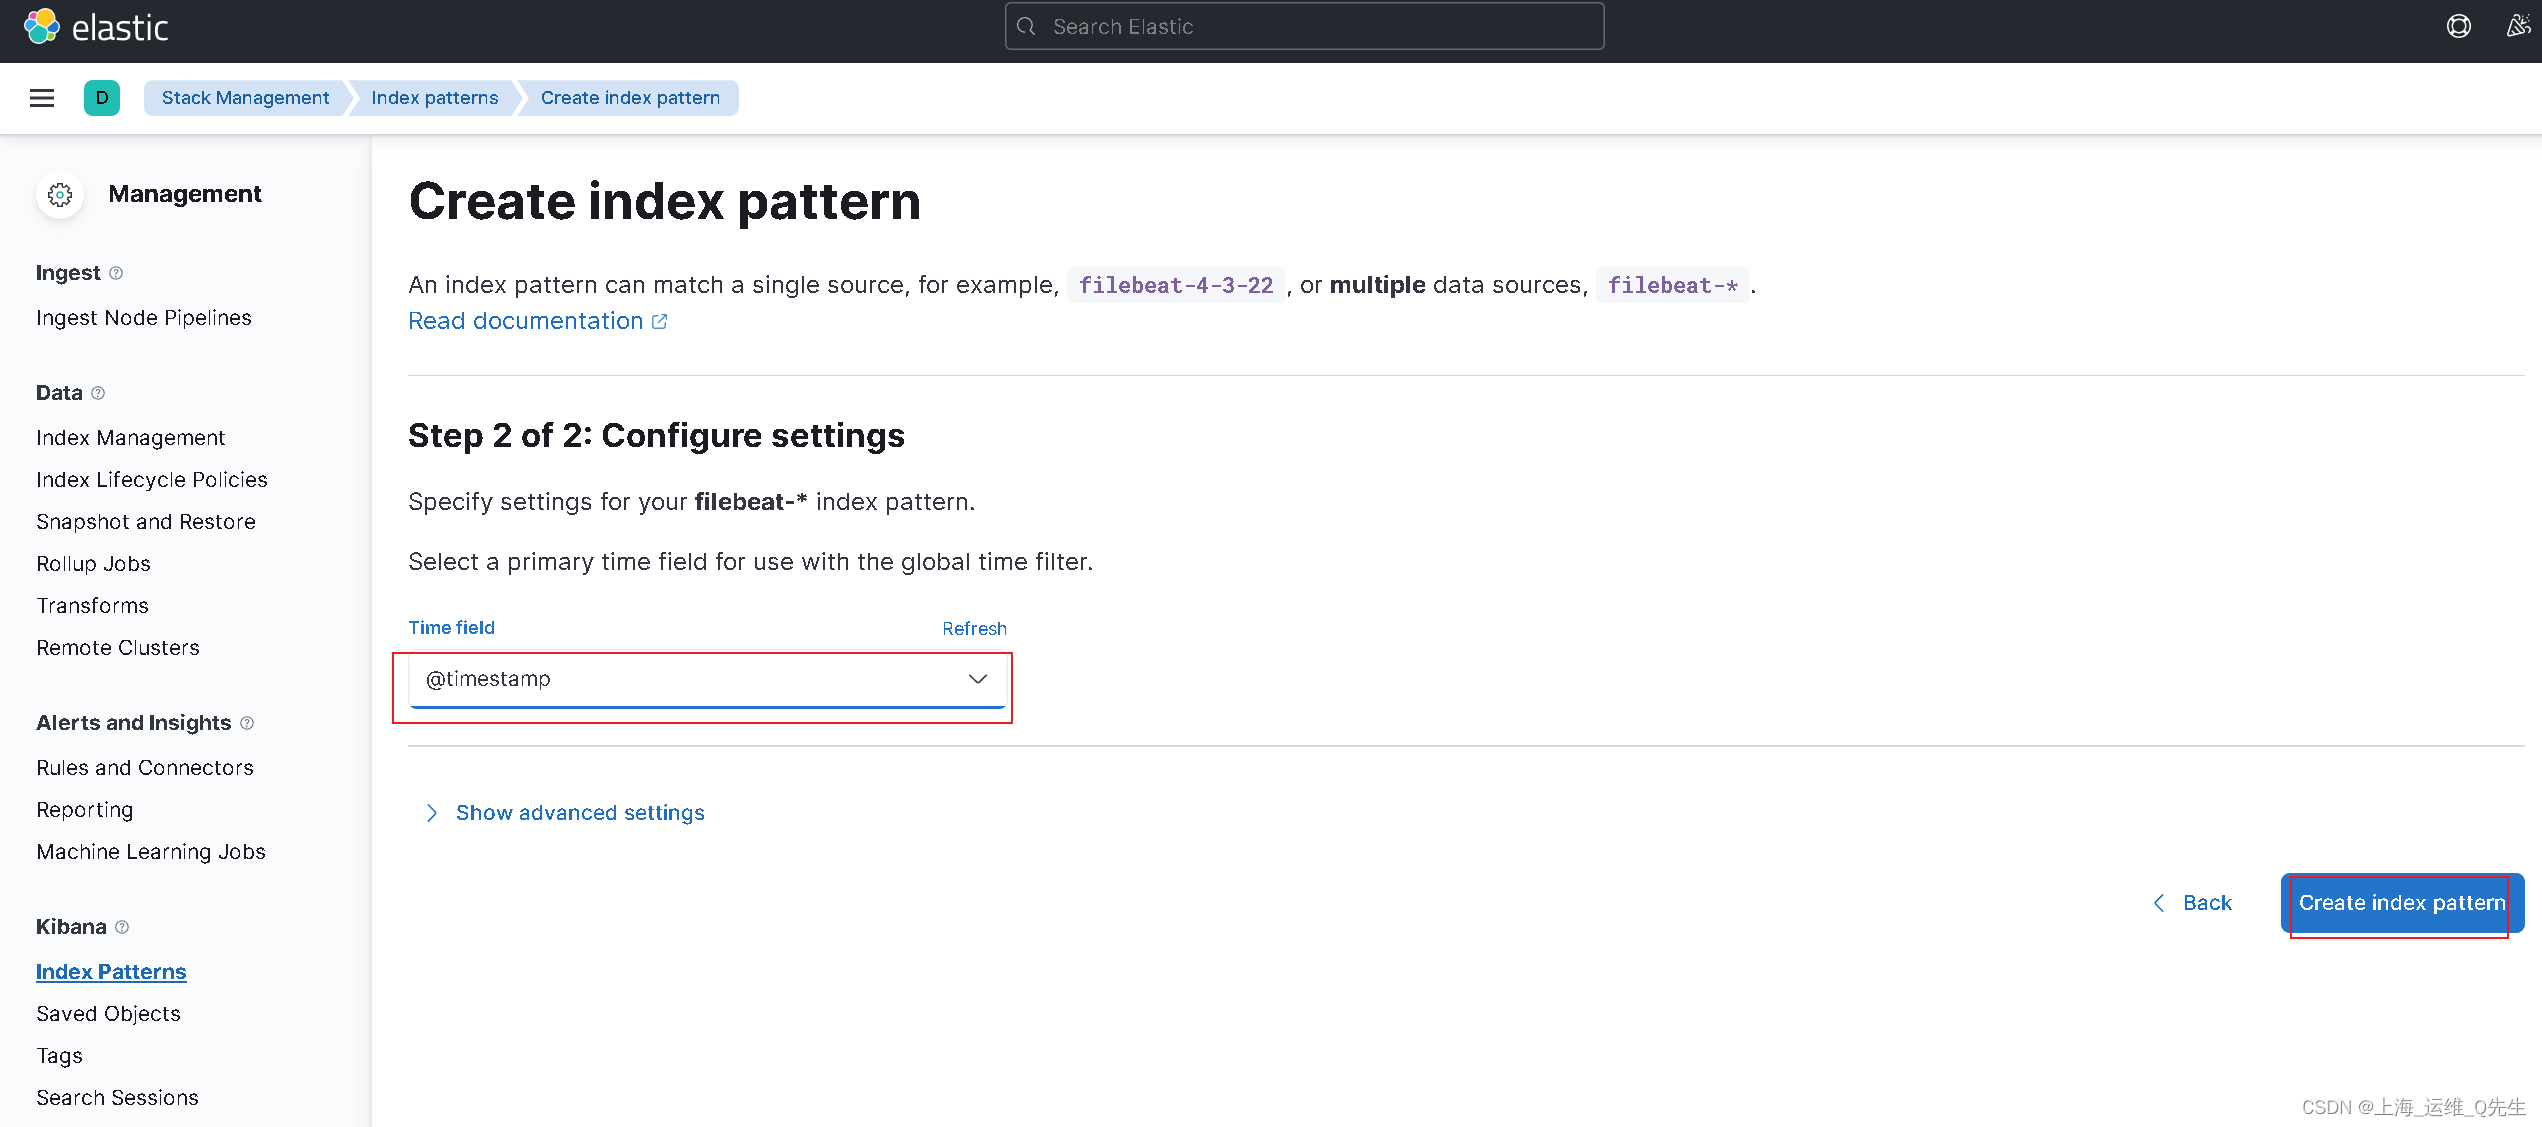
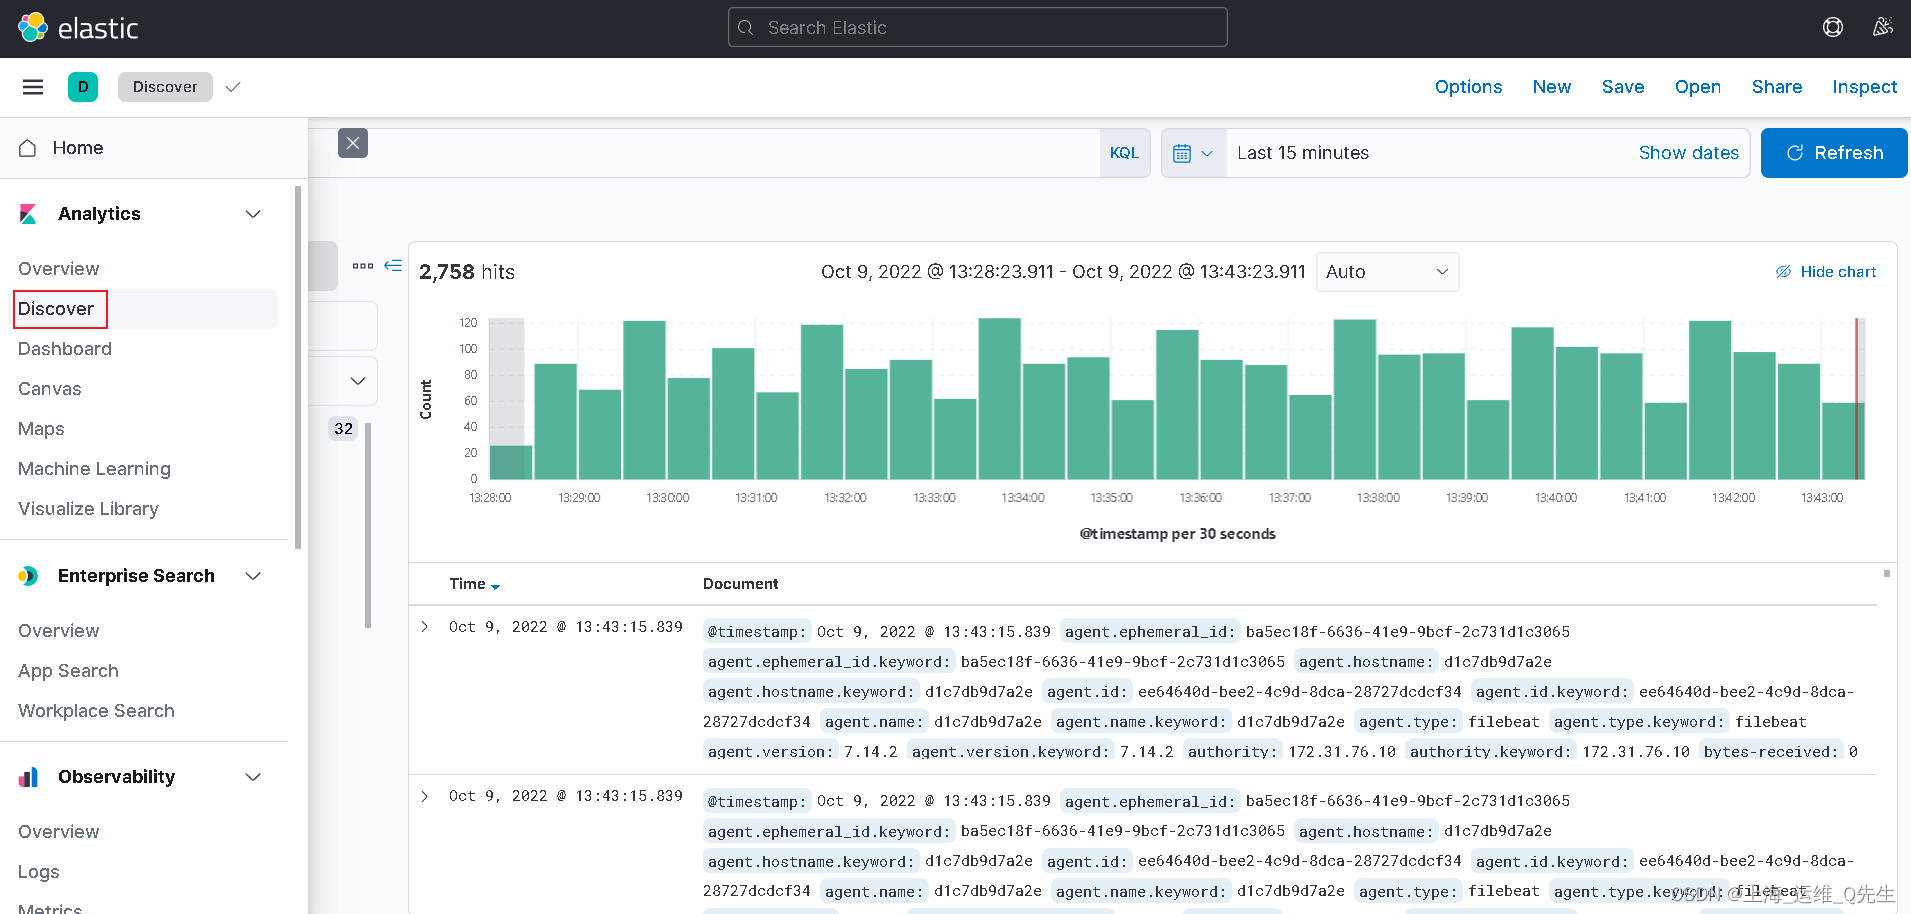
至此,envoy的日志收集及展示就实现了.