Vue 之 echarts 图表数据可视化常用的一些图表/动态图表/3D图表的简单整理
目录
Vue 之 echarts 图表数据可视化常用的一些图表/动态图表/3D图表的简单整理
四、各种 echarts 图表(含代码)
一、简单介绍
Vue 开发的一些知识整理,方便后期遇到类似的问题,能够及时查阅使用。
本节介绍,vue 中添加 echarts ,然后在 vue 中简单使用一些 echarts中常用的图表,包括一些动态的图表、3D的图表等 ,如果有不足之处,欢迎指出,或者你有更好的方法,欢迎留言。
ECharts,一个使用 JavaScript 实现的开源可视化库,可以流畅的运行在 PC 和移动设备上,兼容当前绝大部分浏览器(IE9/10/11,Chrome,Firefox,Safari等),底层依赖矢量图形库 ZRender,提供直观,交互丰富,可高度个性化定制的数据可视化图表。
ECharts 提供了常规的折线图、柱状图、散点图、饼图、K线图,用于统计的盒形图,用于地理数据可视化的地图、热力图、线图,用于关系数据可视化的关系图、treemap、旭日图,多维数据可视化的平行坐标,还有用于 BI 的漏斗图,仪表盘,并且支持图与图之间的混搭。
ECharts 针对移动端交互做了细致的优化,例如移动端小屏上适于用手指在坐标系中进行缩放、平移。 PC 端也可以用鼠标在图中进行缩放(用鼠标滚轮)、平移等。
Echarts 官网文档:Handbook - Apache ECharts
Echarts 官网示例:Examples - Apache ECharts
操作环境:
- win 10
- node v14.20.0
- npm 8.5.3
- @vue/cli 5.0.6
- vue 2.6.14
- echarts 5.3.3
- echarts-liquidfill 3.1.0
- echarts-gl 2.0.9
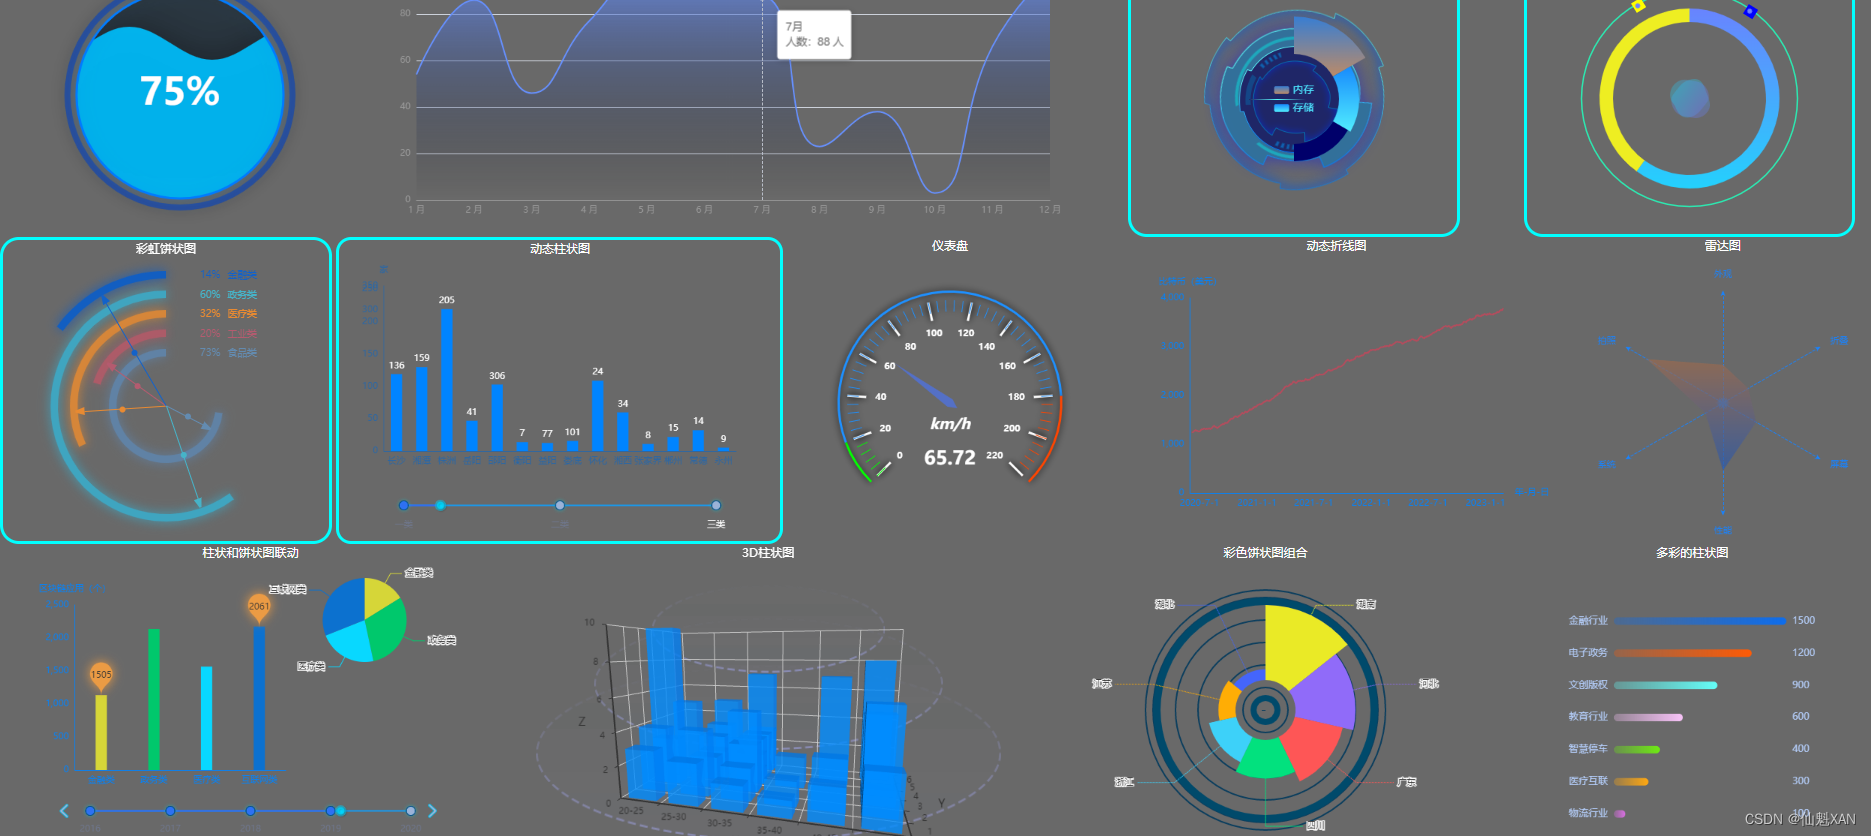
二、效果预览
(有若干图表其实是动态的)
三、注意事项
1、使用水球图时(echarts-liquidfil插件),echarts-liquidfill@3 版本匹配 echarts@5 版本,echarts-liquidfill@2 版本匹配 echarts@4 版本
npm引入:
npm install echarts
npm install echarts-liquidfill

cdn引入:
<script src='echarts.js'></script>
<script src='echarts-liquidfill.js'></script>
2、使用 echarts 3D 的时候,同时也注意下版本匹配,echarts-gl@2 版本匹配 echarts@5 版本,echarts-gl@1 版本匹配 echarts@4 版本
四、各种 echarts 图表(含代码)
1、水球图
注意:除了需要 echarts,还要 echarts-liquidfil 配合

<template>
	<div class="wrap-container">
		<div class="wp-content">
			<div class="wp-title">水球图</div>
			<div class="wp-body">
				<div class="wrap-container">
					<div class="chartsdom" id='chart-polo'></div>
				</div>
			</div>
		</div>
	</div>
</template>

<script>
	// 注意 echartsLiquidfill ver3对应echarts 版本 5;(echartsLiquidfill ver2对应echarts 版本 4)
	// eslint-disable-next-line
	import echartsLiquidfill from "echarts-liquidfill";
	export default {
		name: 'water-polo',
		data() {
			return {
				option: null
			}
		},
		mounted() {
			this.getEchart()
		},
		methods: {
			getEchart() {
				// 获取渲染元素,创建 chart
				let myChart = this.$echarts.init(document.getElementById('chart-polo'))
				this.option = {
					series: [{
						// 水球图类型
						type: 'liquidFill',
						// 名称
						name: "测试",
						// 水波值,可多个
						data: [0.75],
						// 球相对渲染元素的宽高的半径比
						radius: '75%',
						// 水波颜色
						color: ['#00B9F5'],
						// 水波背景的样式
						backgroundStyle: {
							// 背景颜色
							color: 'rgba(0,0,0,0.5)',
							// 边框颜色
							borderColor: '#007bff',
							// 边框宽度
							borderWidth: 3,
							shadowColor: 'rgba(0,123,225,.4)',
							shadowBlur: 20
						},
						// 是否显示外轮廓
						outline: {
							show: true
						},

					}],
					// 鼠标进入是否显示提示
					tooltip:{
						show: true
					}
				}

				myChart.setOption(this.option, true)
				window.addEventListener('resize', () => {
					myChart.resize()
				})
				// 第二种 水球图
				// const dataOption = {
				// 	value: 0.30,
				// 	itemStyle: { //渐变水球颜色
				// 	color: new this.$echarts.graphic.LinearGradient(1, 0, 0, 0, [{
				// 				offset: 0,
				// 				color: "pink",
				// 			},
				// 			{
				// 				offset: 1,
				// 				color: "skyblue",
				// 			},
				// 		]),
				// 	},
				// };
				// this.option = {
				// 	series: [{
				// 		type: "liquidFill",

				// 		// 这三个属性值设置为false静止的波浪
				// 		// waveAnimation: false, //静止的波浪效果
				// 		animationDuration: 1000, // 波浪初始上涨时间
				// 		// eslint-disable-next-line
				//  	    // animationDurationUpdate: 0,//静止的波浪效果
				// 		// 这三个属性值设置为false静止的波浪

				// 		amplitude: "5%", //振幅波浪大小
				// 		name: "一级预警",
				// 		data: [dataOption],
				// 		waveLength: "60%", //波浪长度
				// 		// eslint-disable-next-line
				// 		outline: {
				// 				//隐藏轮廓
				// 				show: false,
				// 			},
				// 		label: {
				// 			//字体内容、字体颜色、字体大小属性
				// 			formatter: "测试",
				// 			color: "#fff",
				// 			fontSize: 30,
				// 		},
				// 		backgroundStyle: {
				// 			//水球图背景
				// 			color: "#101fff",
				// 		},

				// 		// color: ["#F87900"],
				// 	}, ],
				// 	tooltip: {
				// 		//鼠标滑过展示数据
				// 		show: true,
				// 	},
				// };

				// myChart.setOption(this.option);
			}
		}
	}
</script>

<style lang="scss" scoped>
	.wp-title{
		text-align: center;
		color: white;
	}
	.wrap-container {
		width: 400px;
		height: 400px;

		.chartsdom {
			width: 100%;
			height: 100%;
		}
	}
</style>
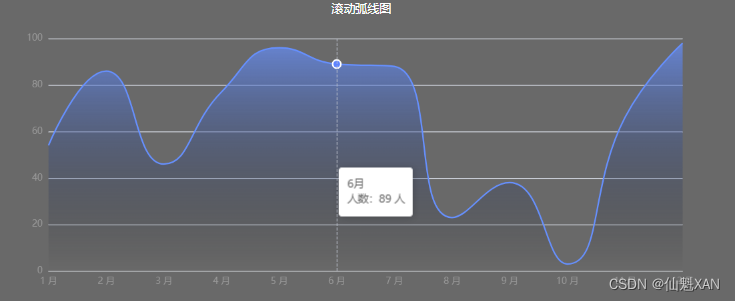
2、滚动弧线图
<template>
	<div class="wrap-container ra-container">
		<div class="ra-content">
			<div class="ra-title">滚动弧线图</div>
			<div class="ra-body">
				<div class="wrap-container">
					<div class="chartsdom" id='chart-rollArc'></div>
				</div>
			</div>
		</div>
	</div>
</template>

<script>
	export default {
		name: 'roll-arcline',
		data() {
			return {
				option: null,
				xIndex: 0,
				timer: null,
				xData: [1, 2, 3, 4, 5, 6, 7, 8, 9, 10, 11, 12],
				yData: [54, 86, 46, 77, 96, 89, 88, 23, 38, 3, 66, 98]
			}
		},

		mounted() {
			this.getEchart()
		},

		methods: {
			getEchart() {
				// 图标渲染体
				const chartRollArc = document.getElementById('chart-rollArc')
				// 初始化图表
				let myChart = this.$echarts.init(chartRollArc)
				this.option = {
					tooltip: {
						trigger: 'axis',
						showContent: true,
						axiosPointer: {
							type: 'shadow',
							shadowStyle: {
								color: new this.$echarts.graphic.LinearGradient(0, 0, 0, 1, [{
										offset: 1,
										color: '#5d83ff'
									},
									{
										offset: 0,
										color: 'rgba(255,255,255,0)'
									}
								])
							}
						},

						// 重新构造图标信息显示(不写会有默认的格式)
						formatter: (params) => {
							// console.log(params)
							params = params[0]
							if (params.seriesIndex === 0)
							// console.log(' origin '+ this.xIndex)
								this.xIndex = parseInt(params.name) - 1
								// console.log(' fuzhi '+ this.xIndex)
							return params.name + '月</br>' + params.seriesName + ':' + params.value + ' 人'
						},
					},

					color: ['#5d83ff'],
					grid: {
						top: 30,
						left: 30,
						right: 20,
						bottom: 20,
						containerLabel: true
					},
					xAxis: {
						type: 'category',
						data: this.xData,
						boundaryGap: false,
						axisTick: {
							show: false
						},
						axisLabel: {
							formatter: '{value} 月'
						},
						axisLine: {
							lineStyle: {
								color: '#999'
							}
						}
					},
					yAxis: {
						type: 'value',
						axisLine: {
							show: false,
							lineStyle: {
								color: '#999'
							}
						},
					},
					series: [{
						name: '人数',
						type: 'line',
						data: this.yData,
						symbolSize: 10,
						itemStyle: {
							opacity: 0,
						},
						emphasis: {
							label: {
								show: true,
								color: '#fff',
								fontSize: 20
							},
							itemStyle: {
								color: '#5d83ff',
								borderColor: '#fff',
								borderWidth: 2,
								opacity: 1
							},
						},
						areaStyle: {
							normal: {
								color: new this.$echarts.graphic.LinearGradient(0, 0, 0, 1, [{
									offset: 0,
									color: '#5d83ff'
								}, {
									offset: 1,
									color: 'rgba(0, 0, 0, 0)'
								}]),
							}
						},
						smooth: true,
					}]

				}

				// 绘制图表
				myChart.setOption(this.option, true);

				// 监听窗口变化
				window.addEventListener('resize', () => {
					myChart.resize();
				});

				// 开启自动显示信息
				this.startChartAutoShowTip(myChart)

				// 鼠标进入停止自动显示信息
				chartRollArc.onmouseover = () => {
					// console.log('mouseover')
					// alert('mouseover')
					this.stopChartAutoShowTip()
				}
				// 退出 chartRollArc 继续自动显示信息
				chartRollArc.onmouseout = () => {
					// console.log('mouseout')
					// alert('mouseout')
					this.startChartAutoShowTip(myChart);
				}

			},

			/**
			 * 自动显示图标信息函数
			 * @param {Object} myChart
			 */
			startChartAutoShowTip(myChart) {
				this.stopChartAutoShowTip()

				this.timer = setInterval(() => {
					// 显示图标信息
					myChart.dispatchAction({
						type: 'showTip',
						seriesIndex: 0,
						dataIndex: this.xIndex
					});

					this.xIndex++;
					// console.log(this.xIndex)
					if (this.xIndex > this.yData.length) {
						this.xIndex = 0;
					}
				}, 1000);

			},

			/**
			 * 停止自动显示图标信息函数
			 */
			stopChartAutoShowTip() {
				if (this.timer != null) {
					clearInterval(this.timer)
					this.timer = null
				}
			}
		},

		beforeDestroy() {
			// 销毁自动显示信息
			this.stopChartAutoShowTip()
		}
	}
</script>

<style lang='scss' scoped>
	/* 标题居中 */
	.ra-title {
		text-align: center;
		color: white;
	}

	/* 内容宽高 */
	.wrap-container {
		width: 895px;
		height: 400px;

		.chartsdom {
			width: 100%;
			height: 90%;
		}
	}
</style>
3、旋转饼状图

<template>
	<div class="wrap-container sn-container">
		<div class="sn-content">
			<div class="sn-title">旋转的饼状图</div>
			<div class="sn-body">
				<div class="wrap-container">
					<div class="pie">
						<div class="pies pie1"></div>
						<div class="pies pie2"></div>
						<div class="pies pie3"></div>
						<div class="pie4"></div>
						<div class="chartsdom" id='chart-pie'></div>
					</div>

				</div>
			</div>
		</div>
	</div>
</template>

<script>
	export default {
		name: 'rotate-pie',
		data() {
			return {

			}
		},
		mounted() {
			this.getEchart()
		},

		methods: {
			getEchart() {
				let myChart = this.$echarts.init(document.getElementById('chart-pie'));
				this.option = {
					tooltip: {
						trigger: 'item',
						formatter: '{a} <br/>{b} : {c} ({d}%)',
					},
					legend: {
						show: true,
						orient: 'vertical',
						left: 'center',
						top: 'middle',
						data: ['内存', '存储'],
						textStyle: {
							color: '#4ce5ff',
							fontSize: 14,
						},
						itemWidth: 20,
						itemHeight: 10
					},
					label: {
						normal: {
							show: false
						},
					},
					labelLine: {
						normal: {
							show: false
						}
					},
					series: [{
						name: '磁盘空间',
						type: 'pie',
						radius: [60, 110],
						center: ['50%', '50%'],
						roseType: 'area',
						label: {
							show: false
						},
						emphasis: {
							label: {
								show: false
							}
						},
						data: [{
							value: 6.5,
							name: '内存',
							itemStyle: {
								normal: {
									color: new this.$echarts.graphic.LinearGradient(0, 0, 0, 1, [{
										offset: 0,
										color: '#387ed3'
									}, {
										offset: 1,
										color: '#bc8b68'
									}])
								}
							}
						}, {
							value: 3.5,
							name: '存储',
							itemStyle: {
								normal: {
									color: new this.$echarts.graphic.LinearGradient(0, 0, 0, 1, [{
										offset: 0,
										color: '#188bfd'
									}, {
										offset: 1,
										color: '#51eeff'
									}])
								}
							}
						}, {
							value: 3,
							name: '其他',
							itemStyle: {
								normal: {
									color: 'rgba(0, 0, 106, 1)'
								}
							}
						}, {
							value: 0,
							name: '其他1',
							itemStyle: {
								normal: {
									color: 'rgba(0, 0, 0, 0)'
								}
							}
						}, {
							value: 0,
							name: '其他2',
							itemStyle: {
								normal: {
									color: 'rgba(0, 0, 0, 0)'
								}
							}
						}, {
							value: 0,
							name: '其他3',
							itemStyle: {
								normal: {
									color: 'rgba(0, 0, 0, 0)'
								}
							}
						}]
					}]
				}

				myChart.setOption(this.option, true);

				window.addEventListener('resize', () => {
					myChart.resize();
				});
			}
		}
	}
</script>
<style lang="scss" scoped>
	.sn-title {
		text-align: center;
		color: white;
	}
	.sn-container{
		border:5px solid aqua;
		border-radius: 25px;
	}
	.wrap-container {
		background: 'rgba(1,1,1,0)';
		width: 432px;
		height: 400px;


		.chartsdom {
			width: 100%;
			height: 100%;
		}

		.pie {
			position: relative;
			top: 0;
			width: 100%;
			height: 100%;

			.pies {
				width: 100%;
				height: 100%;
				top: 0;
				left: 0;
				position: absolute;
				background-repeat: no-repeat;
				background-position: center center;
			}

			.pie1 {
				background-image: url(../../assets/img/whcircle.png);
				animation: mymove 20s linear infinite;
				-webkit-animation: mymove 20s linear infinite;
			}

			.pie2 {
				background-image: url(../../assets/img/circle2.png);
				animation: moveto 20s linear infinite;
				-webkit-animation: moveto 20s linear infinite;
			}

			.pie3 {
				background-image: url(../../assets/img/inner.png);
			}

			// 分割线 内存/存储
			.pie4 {
				position: absolute;
				top: 50%;
				left: 36%;
				width: 76px;
				height: 1px;
				background: linear-gradient(to right, rgb(31, 38, 103), rgb(90, 250, 253), rgb(31, 38, 103));
			}

		}
	}

	/**
	* animation 动画
	*/
	@-webkit-keyframes mymove {
		0% {
			-webkit-transform-origin: center;
			transform-origin: center;
			-webkit-transform: rotate(0deg);
			transform: rotate(0deg)
		}

		100%{
			-webkit-transform-origin: center;
			transform-origin: center;
			-webkit-transform: rotate(360deg);
			transform: rotate(360deg);
		}
	}
	@keyframes mymove{
		0% {
			-webkit-transform-origin: center;
			transform-origin: center;
			-webkit-transform: rotate(0deg);
			transform: rotate(0deg);
		}
		100%{
			-webkit-transform-origin: center;
			transform-origin: center;
			-webkit-transform: rotate(360deg);
			transform: rotate(360deg);
		}
	}

	@-webkit-keyframes moveto {
		0% {
			-webkit-transform-origin: center;
			transform-origin: center;
			-webkit-transform: rotate(0deg);
			transform: rotate(0deg)
		}

		100%{
			-webkit-transform-origin: center;
			transform-origin: center;
			-webkit-transform: rotate(-360deg);
			transform: rotate(-360deg);
		}
	}
	@keyframes moveto{
		0% {
			-webkit-transform-origin: center;
			transform-origin: center;
			-webkit-transform: rotate(0deg);
			transform: rotate(0deg);
		}
		100%{
			-webkit-transform-origin: center;
			transform-origin: center;
			-webkit-transform: rotate(-360deg);
			transform: rotate(-360deg);
		}
	}
</style>
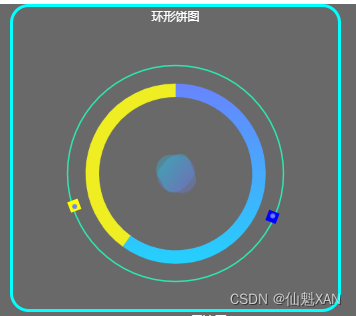
4、环状饼图
<template>
	<div class="wrap-container sn-container">
		<div class="sn-content">
			<div class="sn-title">环形饼图</div>
			<div class="sn-body">
				<div class="wrap-container ring-pie">
					<div class="back-chart">
						<svg width="100%" height="100%" viewBox="0 0 150 150" version="1.1"
							xmlns="http://www.w3.org/2000/svg" xmlns:xlink="http://www.w3.org/1999/xlink">
							<path id="svg_2"
								d="m3,75c0,-39.77901 32.22099,-72 72,-72c39.77901,0 72,32.22099 72,72c0,39.77901 -32.22099,72 -72,72c-39.77901,0 -72,-32.22099 -72,-72z"
								stroke="#2de6af" fill-opacity="null" fill="none"></path>
						</svg>

					</div>
					<div class="chartsdom" id="chart_rp"></div>
					<div class="arrow-cir1">
						<div class="arrow-cir11"></div>
					</div>
					<div class="arrow-cir2">
						<div class=" arrow-cir22"></div>
					</div>

				</div>
			</div>
		</div>
	</div>
</template>

<script>
	export default {
		name: 'ring-pie',

		mounted() {
			this.getEchart();
		},
		methods: {
			getEchart() {
				let myChart = this.$echarts.init(document.getElementById('chart_rp'));
				this.option = {
					tooltip:{
						show:true
					},
					series: [{
						name: '环形饼图',
						type: 'pie',
						radius: ['68%', '80%'],
						hoverAnimation: true,
						avoidLabelOverlap: false,
						label: {
							show: false,
							position: 'center'
						},
						emphasis: {
							label: {
								show: true
							}
						},
						labelLine: {
							show: true
						},
						data: [{
							value: 6,
							name: '区块链',
							itemStyle: {
								normal: {
									color: new this.$echarts.graphic.LinearGradient(0, 0, 0, 1, [{
										offset: 0,
										color: '#6984fe'
									}, {
										offset: 1,
										color: '#24d1fd'
									}])
								}
							}
						}, {
							value: 4,
							name: '大数据',
							itemStyle: {
								normal: {
									color: '#ee2'
								}
							}
						}]
					}]
				}

				myChart.setOption(this.option, true);

				window.addEventListener('resize', () => {
					myChart.resize();
				});
			}
		},
	}
</script>

<style lang="scss" scoped>
	.sn-title {
		text-align: center;
		color: white;
	}

	.sn-container {
		width: 432px;
		height: 400px;
		border: 5px solid aqua;
		border-radius: 25px;
	}

	.wrap-container {
		position: relative;
		width: 432px;
		height: 400px;

		.back-chart {
			position: absolute;
			top: 0;
			left: 0;
			right: 0;
			bottom: 0;
			margin: auto;
			width: 300px;
			height: 300px;
			background: url(../../assets/img/back_chart.png) no-repeat center;

		}

		.chartsdom {
			position: absolute;
			top: 0;
			left: 0;
			right: 0;
			bottom: 0;
			margin: auto;
			width: 300px;
			height: 300px;
			z-index: 9999;
		}

		.arrow-cir1 {
			// border: 5px solid red;
			// border-radius: 25px;
			width: 300px;
			height: 300px;
			offset-distance: 0%;
			position: absolute;
			top: 0;
			left: 0;
			right: 0;
			bottom: 0;
			margin: auto;
			-webkit-animation: arrow-cir1 5s linear infinite;
			animation: arrow-cir1 5s linear infinite;
			.arrow-cir11 {
				position: absolute;
				width: 15px;
				height: 15px;
				top: 0.5%;
				left: 50%;
				background: url(../../assets/img/icon_04.png) no-repeat 50% 50%;
				background-color: blue;
			}
		}

		.arrow-cir2 {
			// border: 5px solid red;
			// border-radius: 25px;
			width: 300px;
			height: 300px;
			offset-distance: 0%;
			position: absolute;
			top: 0;
			left: 0;
			right: 0;
			bottom: 0;
			margin: auto;
			-webkit-animation: arrow-cir2 5s linear infinite;
			animation: arrow-cir2 5s linear infinite;
			.arrow-cir22 {
				position: absolute;
				width: 15px;
				height: 15px;
				top: 0.5%;
				left: 50%;
				background: url(../../assets/img/icon_04.png) no-repeat 50% 50%;
				background-color: yellow;
			}

		}

	}

@-webkit-keyframes arrow-cir1{
	0%{
		-webkit-transform-origin: center;
		transform-origin: center;
		-webkit-transform: rotate(0deg);
		transform: rotate(0deg)
	}
	100% {
		-webkit-transform-origin: center;
		transform-origin: center;
		-webkit-transform: rotate(360deg);
		transform: rotate(360deg);
	}
}

@keyframes arrow-cir1{
	0%{
		-webkit-transform-origin: center;
		transform-origin: center;
		-webkit-transform: rotate(0deg);
		transform: rotate(0deg)
	}
	100% {
		-webkit-transform-origin: center;
		transform-origin: center;
		-webkit-transform: rotate(360deg);
		transform: rotate(360deg);
	}
}

@-webkit-keyframes arrow-cir2{
	0%{
		-webkit-transform-origin: center;
		transform-origin: center;
		-webkit-transform: rotate(0deg);
		transform: rotate(0deg)
	}
	100% {
		-webkit-transform-origin: center;
		transform-origin: center;
		-webkit-transform: rotate(-360deg);
		transform: rotate(-360deg);
	}
}

@keyframes arrow-cir2{
	0%{
		-webkit-transform-origin: center;
		transform-origin: center;
		-webkit-transform: rotate(0deg);
		transform: rotate(0deg)
	}
	100% {
		-webkit-transform-origin: center;
		transform-origin: center;
		-webkit-transform: rotate(-360deg);
		transform: rotate(-360deg);
	}
}
</style>
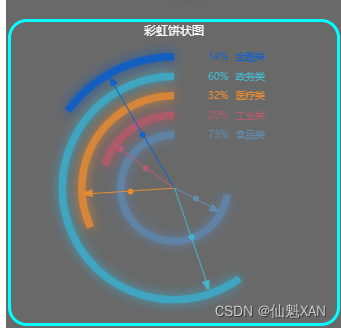
5、彩虹饼状图
<template>
	<div class="wrap-container sn-container">
		<div class="sn-content">
			<div class="sn-title">彩虹饼状图</div>
			<div class="sn-body">
				<div class="wrap-container">
					<div class="chartsdom" id='chart-rainbow'></div>

					<div class="preinfo" v-for='(item,ind) in arrData' :key='ind' :class="`preinfo${ind}`">
						<span>{

   { item.percent }}%</span>
						<span>{

   { item.name }}</span>
					</div>

					<div class="preinfos" :class="`pre${i}`" v-for="(v, i) in arrData" :key='i'>
						<span></span>
						<span></span>
					</div>
				</div>
			</div>
		</div>
	</div>
</template>

<script>
	export default {
		name: 'ranbow-pies',
		data() {
			return {
				option: null,
				arrData: [{
					name: '食品类',
					percent: 73
				}, {
					name: '工业类',
					percent: 20
				}, {
					name: '医疗类',
					percent: 32
				}, {
					name: '政务类',
					percent: 60
				}, {
					name: '金融类',
					percent: 14
				}]
			}
		},
		mounted() {
			this.getEchart();
		},
		methods: {
			getEchart() {
				let myChart = this.$echarts.init(document.getElementById('chart-rainbow'));
				let itemStyle = {
					normal: {
						color: 'rgba(0, 0, 0, 0)',
					}
				}

				this.option = {
					color: ['#125ec1', '#3fa5c0', '#d68639', '#ad5b68', '#6082a5'],
					series: [{
						name: '金融类',
						type: 'pie',
						clockWise: false,
						startAngle: 90,
						hoverAnimation: false,
						radius: ['85%', '90%'],
						center: ['50%', '50%'],
						label: {
							normal: {
								show: false
							},
						},
						labelLine: {
							normal: {
								show: false
							}
						},
						itemStyle: {
							shadowColor: '#125ec1',
							shadowBlur: 15
						},
						data: [{
							value: 15,
							name: '15%',
							itemStyle: {
								normal: {
									color: '#125ec1'
								}
							}
						}, {
							value: 85,
							name: '50%',
							itemStyle: itemStyle
						}]
					}, {
						name: '政务类',
						type: 'pie',
						clockWise: false,
						startAngle: 90,
						hoverAnimation: false,
						radius: ['72%', '77%'],
						center: ['50%', '50%'],
						label: {
							normal: {
								show: false
							},
						},
						labelLine: {
							normal: {
								show: false
							}
						},
						itemStyle: {
							shadowColor: '#3fa5c0',
							shadowBlur: 15
						},
						data: [{
							value: 60,
							name: '60%',
							itemStyle: {
								normal: {
									color: '#3fa5c0'
								}
							}
						}, {
							value: 40,
							name: '40%',
							itemStyle: itemStyle
						}]
					}, {
						name: '医疗类',
						type: 'pie',
						clockWise: false,
						startAngle: 90,
						hoverAnimation: false,
						radius: ['59%', '64%'],
						center: ['50%', '50%'],
						label: {
							normal: {
								show: false
							},
						},
						labelLine: {
							normal: {
								show: false
							}
						},
						itemStyle: {
							shadowColor: '#d68639',
							shadowBlur: 15
						},
						data: [{
							value: 32,
							name: '32%',
							itemStyle: {
								normal: {
									color: '#d68639'
								}
							}
						}, {
							value: 68,
							name: '68%',
							itemStyle: itemStyle
						}]
					}, {
						name: '工业类',
						type: 'pie',
						clockWise: false,
						startAngle: 90,
						hoverAnimation: false,
						radius: ['46%', '51%'],
						center: ['50%', '50%'],
						label: {
							normal: {
								show: false
							},
						},
						labelLine: {
							normal: {
								show: false
							}
						},
						itemStyle: {
							shadowColor: '#ad5b68',
							shadowBlur: 15
						},
						data: [{
							value: 20,
							name: '20%',
							itemStyle: {
								normal: {
									color: '#ad5b68'
								}
							}
						}, {
							value: 80,
							name: '80%',
							itemStyle: itemStyle
						}]
					}, {
						name: '食品类',
						type: 'pie',
						clockWise: false,
						startAngle: 90,
						hoverAnimation: false,
						radius: ['33%', '38%'],
						center: ['50%', '50%'],
						label: {
							normal: {
								show: false
							},
						},
						labelLine: {
							normal: {
								show: false
							}
						},
						itemStyle: {
							shadowColor: '#6082a5',
							shadowBlur: 15
						},
						data: [{
							value: 73,
							name: '73%',
							itemStyle: {
								normal: {
									color: '#6082a5'
								}
							}
						}, {
							value: 27,
							name: '27%',
							itemStyle: itemStyle
						}]
					}]
				}

				// 使用制定的配置项和数据显示图表
				myChart.setOption(this.option, true);

				window.addEventListener('resize', () => {
					myChart.resize();
				});
			}
		},
	}
</script>

<style lang="scss" scoped>
	.sn-title {
		text-align: center;
		color: white;
	}

	.sn-container {
		border: 5px solid aqua;
		border-radius: 25px;
	}

	.wrap-container {
		position: relative;
		width: 432px;
		height: 400px;

		.chartsdom {
			width: 100%;
			height: 100%;
		}

		.preinfo {
			position: absolute;
			left: 68%;
			top: 5%;
			margin-left: -2.5em;
			-webkit-transform: translate(0%, -50%);
			-moz-transform: translate(0%, -50%);
			-ms-transform: translate(0%, -50%);
			-o-transform: translate(0%, -50%);
			transform: translate(0%, -50%);
			white-space: nowrap;
			font-size: 13px;

			span {
				&:nth-child(1) {
					margin-right: 10px;
				}
			}

			&.preinfo0 {
				color: rgb(99, 139, 176);
				margin-top: 25%;
			}

			&.preinfo1 {
				color: rgb(180, 91, 111);
				margin-top: 19%;
			}

			&.preinfo2 {
				color: rgb(232, 138, 50);
				margin-top: 13%;
			}

			&.preinfo3 {
				color: rgb(70, 179, 200);
				margin-top: 7%;
			}

			&.preinfo4 {
				color: rgb(19, 98, 201);
				margin-top: 1%;
			}
		}

		.preinfos {
			position: absolute;
			left: 50%;
			top: 50%;
			width: 1px;
			height: 58px;
			background-color: rgb(99, 139, 176);
			-webkit-transform-origin: 50% 0;
			-moz-transform-origin: 50% 0;
			-ms-transform-origin: 50% 0;
			-o-transform-origin: 50% 0;
			transform-origin: 50% 0;

			span {
				&:nth-child(1) {
					width: 8px;
					height: 8px;
					-webkit-border-radius: 100%;
					-moz-border-radius: 100%;
					border-radius: 100%;
					position: absolute;
					left: -3px;
					top: 50%;
				}

				&:nth-child(2) {
					width: 0;
					height: 0;
					border-width: 12px 5px 5px 5px;
					border-style: solid;
					position: absolute;
					left: -5px;
					top: 100%;
				}
			}

			&.pre0 {
				height: 55px;
				background-color: rgb(99, 139, 176);
				transform: rotate(-62.614deg);

				span {
					&:nth-child(1) {
						background-color: rgb(99, 139, 176);
					}

					&:nth-child(2) {
						border-color: rgb(99, 139, 176) transparent transparent;
					}
				}
			}

			&.pre1 {
				height: 85px;
				background-color: rgb(180, 91, 111);
				transform: rotate(125.593deg);

				span {
					&:nth-child(1) {
						background-color: rgb(180, 91, 111);
					}

					&:nth-child(2) {
						border-color: rgb(180, 91, 111) transparent transparent;
					}
				}
			}

			&.pre2 {
				height: 109px;
				background-color: rgb(232, 138, 50);
				transform: rotate(86.2006deg);

				span {
					&:nth-child(1) {
						background-color: rgb(232, 138, 50);
					}

					&:nth-child(2) {
						border-color: rgb(232, 138, 50) transparent transparent;
					}
				}
			}

			&.pre3 {
				height: 131px;
				background-color: rgb(70, 179, 200);
				transform: rotate(-18.845deg);

				span {
					&:nth-child(1) {
						background-color: rgb(70, 179, 200);
					}

					&:nth-child(2) {
						border-color: rgb(70, 179, 200) transparent transparent;
					}
				}
			}

			&.pre4 {
				height: 158px;
				background-color: rgb(19, 98, 201);
				transform: rotate(149.666deg);

				span {
					&:nth-child(1) {
						background-color: rgb(19, 98, 201);
					}

					&:nth-child(2) {
						border-color: rgb(19, 98, 201) transparent transparent;
					}
				}
			}
		}
	}
</style>
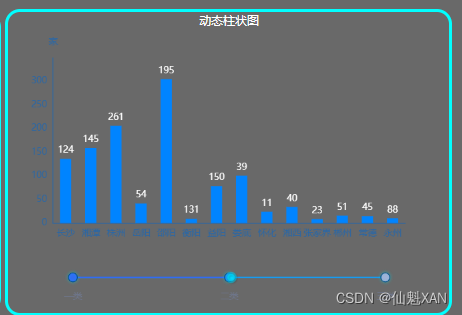
6、动态柱状图
<template>
	<div class="wrap-container sn-container">
		<div class="sn-content">
			<div class="sn-title">动态柱状图</div>
			<div class="sn-body">
				<div class="wrap-container">
					<div class="chartsdom" id='chart-dynamic-bar'></div>
				</div>
			</div>
		</div>
	</div>
</template>

<script>
	export default {
		name: 'dynamic-bar',
		data() {
			return {
				option: null,
				dataMap: {}
			}
		},

		mounted() {
			this.getEchart();
		},
		methods: {
			dataFormatter(obj) {
				let pList = ['长沙', '湘潭', '株洲', '岳阳', '邵阳', '衡阳', '益阳', '娄底', '怀化', '湘西', '张家界', '郴州', '常德', '永州'];
				let temp;
				for (let x = 0; x < 3; x++) {
					let max = 0;
					let sum = 0;
					temp = obj[x];
					for (let i = 0, l = temp.length; i < l; i++) {
						max = Math.max(max, temp[i]);
						sum += temp[i];
						obj[x][i] = {
							name: pList[i],
							value: temp[i]
						};
					}
					obj[x + 'max'] = Math.floor(max / 100) * 100;
					obj[x + 'sum'] = sum;
				}
				return obj;
			},
			getEchart() {
				let myChart = this.$echarts.init(document.getElementById('chart-dynamic-bar'));
				let itemStyle = {
					barBorderRadius: [15, 0],
					color: '#0084ff'
				}

				this.dataMap.dataType = this.dataFormatter({
					2: [124, 145, 261, 54, 195, 131, 150, 39, 11, 40, 23, 51, 45, 88],
					1: [136, 159, 205, 41, 306, 7, 77, 101, 24, 34, 8, 15, 14, 9],
					0: [118, 128, 220, 47, 92, 14, 9, 11, 113, 61, 11, 22, 33, 5],
				});

				console.log("this.dataMap.dataType", this.dataMap.dataType)

				this.option = {
					baseOption: {
						timeline: {
							axisType: 'category',
							autoPlay: true,
							playInterval: 1000,
							data: ['一类', '二类', '三类'],
							left: 80,
							right: 80,
							bottom: 30,
							lineStyle: {
								color: '#179bf1'
							},
							label: {
								color: '#fff'
							},
							checkpointStyle: {
								color: '#01d8ff',
								symbolSize: 10,
								borderColor: 'rgba(1, 216, 255, 0.5)',
								borderWidth: 5,
							},
							controlStyle: {
								show: false,
							},
							itemStyle: {
								borderColor: '#004b85',
								borderWidth: 1,
								shadowColor: 'rgba(1, 216, 225, 0.5)',
								shadowBlur: 5
							},
							emphasis: {
								label: {
									color: '#01d8ff',
									show: false
								},
								checkpointStyle: {
									color: '#01d8ff',
									borderColor: 'rgba(1, 216, 255, 0.5)',
									borderWidth: 5,
								},
								itemStyle: {
									color: '#01d8ff',
								borderColor: 'rgba(1, 216, 225, 0.5)',
									borderWidth: 5
								}
							}
						},
						calculable: true,
						grid: {
							top: '10%',
							bottom: '35%'
						},
						xAxis: [{
							type: 'category',
							axisLabel: {
								interval: 0
							},
							data: ['长沙', '湘潭', '株洲', '岳阳', '邵阳', '衡阳', '益阳', '娄底', '怀化', '湘西', '张家界', '郴州',
								'常德', '永州'
							],
							splitLine: {
								show: false
							},
							axisTick: {
								show: false
							},
							axisLine: {
								show: true,
								lineStyle: {
									color: '#2867a8',
								}
							},
						}],
						yAxis: [{
							type: 'value',
							name: '家',
							splitLine: {
								show: false
							},
							axisTick: {
								show: false
							},
							axisLine: {
								show: true,
							lineStyle: {
									color: '#2867a8'
								}
							}
						}],
						series: [{
							name: '一类',
							type: 'bar',
							barWidth: 15,
							legendHoverLink: true,
							label: {
								show: true,
								position: 'top',
								color: '#fff'
							},
						}]
					},
					options: [{
						series: [{
							data: this.dataMap.dataType['0'],
							itemStyle: itemStyle
						}]
					}, {
						series: [{
							data: this.dataMap.dataType['1'],
							itemStyle: itemStyle
						}]
					}, {
						series: [{
							data: this.dataMap.dataType['2'],
							itemStyle: itemStyle
						}]
					}]
				}

				myChart.setOption(this.option, true);

				window.addEventListener('resize', () => {
					myChart.resize();
				});
			}
		}
	}
</script>

<style lang='scss' scoped>
	.sn-title{
		text-align: center;
		color: white;
	}
	.sn-container{
		border: 5px solid aqua;
		border-radius: 20px;
	}
	.wrap-container{
		width:  586px;
		height: 400px;

		.chartsdom{
			width: 100%;
			height: 100%;
		}
	}
</style>
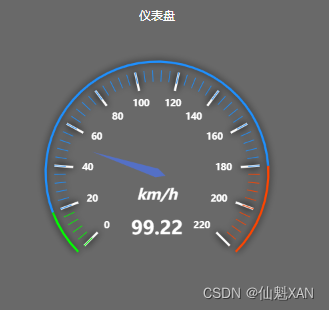
7、仪表盘
<template>
	<div class="wrap-container sn-container">
		<div class="sn-content">
			<div class="sn-title">仪表盘</div>
			<div class="sn-body">
				<div class="wrap-container">
					<div class="chartsdom" id='chart-gauge'></div>
				</div>
			</div>
		</div>
	</div>
</template>

<script>
	export default {
		name: 'gauge-chart',
		data() {
			return {
				option: null,
				timer: null
			}
		},
		mounted() {
			this.getEchart()
		},
		methods: {
			getEchart() {
				let myChart = this.$echarts.init(document.getElementById('chart-gauge'))
				this.option = {
					tooltip: {
						formatter: '{a} <br/>{c} {b}'
					},
					series: [{
						name: '速度',
						type: 'gauge',
						min: 0,
						max: 220,
						splitNumber: 11,
						// radius: '50%',
						axisLine: { // 坐标轴线
							lineStyle: { // 属性lineStyle控制线条样式
							color: [
								[0.09, 'lime'],
								[0.82, '#1e90ff'],
								[1, '#ff4500']
							],
							width: 3,
								// shadowColor: '#fff', //默认透明
								shadowBlur: 10
							}
						},
						axisLabel: { // 坐标轴小标记
							fontWeight: 'bolder',
							color: '#fff',
							shadowColor: '#fff', //默认透明
							shadowBlur: 10
						},
						axisTick: { // 坐标轴小标记
							length: 15, // 属性length控制线长
							lineStyle: { // 属性lineStyle控制线条样式
							color: 'auto',
								// shadowColor: '#fff', //默认透明
								shadowBlur: 10
							}
						},
						splitLine: { // 分隔线
							length: 25, // 属性length控制线长
							lineStyle: { // 属性lineStyle(详见lineStyle)控制线条样式
								width: 3,
								color: '#fff',
								// shadowColor: '#fff', //默认透明
								shadowBlur: 10
							}
						},
						pointer: { // 分隔线
							// shadowColor: '#fff', //默认透明
							shadowBlur: 5
						},
						title: {
							textStyle: { // 其余属性默认使用全局文本样式,详见TEXTSTYLE
								fontWeight: 'bolder',
								fontSize: 20,
								fontStyle: 'italic',
								color: '#fff',
								shadowColor: '#fff', //默认透明
								shadowBlur: 10
							}
						},
						detail: {
							// backgroundColor: 'rgba(30,144,255,0.8)',
							// borderWidth: 1,
							// borderColor: '#fff',
							// shadowColor: '#fff', //默认透明
							// shadowBlur: 5,
							offsetCenter: [0, '50%'], // x, y,单位px
							textStyle: { // 其余属性默认使用全局文本样式,详见TEXTSTYLE
								fontWeight: 'bolder',
								fontSize: 25,
								color: '#fff'
							}
						},
						data: [{
							value: 40,
							name: 'km/h'
						}]
					}]
				}


				myChart.setOption(this.option, true);

				window.addEventListener('resize', () => {
					myChart.resize();
				});

				this.timer = setInterval(()=>{
					this.option.series[0].data[0].value = (Math.random()*200).toFixed(2) -0
					myChart.setOption(this.option, true)
				},1000)
			}
		},
		beforeDestroy() {
			clearInterval(this.timer);
		}
	}
</script>

<style lang="scss" scoped>
	.sn-title{
		text-align: center;
		color: white;
	}
	.wrap-container{
		width: 432px;
		height: 400px;
		.chartsdom{
			width: 100%;
			height: 100%;
		}
	}
</style>
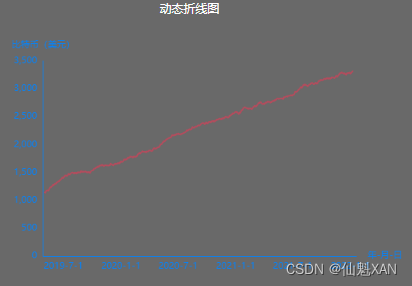
8、动态折线图
<template>
	<div class="wrap-container sn-container">
		<div class="sn-content">
			<div class="sn-title">动态折线图</div>
			<div class="sn-body">
				<div class="wrap-container">
					<div class="chartsdom" id='chart-dynamic-line'></div>
				</div>
			</div>
		</div>
	</div>
</template>

<script>
	export default {
		name: 'dynamic-line',
		data() {
			return {
				option: null,
				timer: null,
				xData: [],
				now: new Date(2019, 1, 1),
				value: Math.random() * 1000,
				oneDay: 24 * 3600 * 1000
			}
		},

		mounted() {
			this.getEchart();
		},

		methods: {
			randomData() {
				this.now = new Date(+this.now + this.oneDay)
				this.value = this.value + Math.random() * 25 - 10
				return {
					name: this.now.toString(),
					value: [
						[this.now.getFullYear(), this.now.getMonth() , this.now.getDate()].join('/'),
						Math.round(this.value)
					]
				}
			},

			getEchart() {
				let myChart = this.$echarts.init(document.getElementById('chart-dynamic-line'));
				for (let i = 0; i < 1000; i++) {
				this.xData.push(this.randomData());
			}

				this.option = {
					tooltip: {
						trigger: 'axis',
						axisPointer: {
							type: 'cross',
							axisPointer: {
								type: 'cross',
								label: {
									backgroundColor: '#283b56'
								}
							}
						}
					},
					grid: {
						top: '15%',
						left: '10%',
						right: '12%',
						bottom: '15%',
						containLabel: true
					},
					color: ['#b54c5d'],
					calculable: true,
					xAxis: {
						type: 'time',
						name: '年-月-日',
						boundaryGap: false,
						splitNumber: 5,
						axisLabel: {
							formatter(value) {
								let date = new Date(value);
								return date.getFullYear() + '-' + (date.getMonth() + 1) + '-' + date.getDate();
							}
						},
						axisTick: {
							show: false
						},
						axisLine: {
							show: true,
							lineStyle: {
								color: '#0084ff'
							}
						},
						splitLine: {
							show: false
						}
					},
					yAxis: {
						type: 'value',
						scale: true,
						name: '比特币(美元)',
						min: 0,
						boundaryGap: false,
						axisTick: {
							show: false
						},
						axisLine: {
							show: true,
							lineStyle: {
								color: '#0084ff'
							}
						},
						splitLine: {
							show: false
						},
					},
					series: [{
						name: '实时交易',
						type: 'line',
						xAxisIndex: 0,
						yAxisIndex: 0,
						itemStyle: {
							opacity: 0,
						},
						data: this.xData,
						smooth: true
					}]
				}

				myChart.setOption(this.option, true);

				window.addEventListener('resize', () => {
					myChart.resize();
				});

				this.timer = setInterval(() => {
					for (let i = 0; i < 5; i++){
						this.xData.shift();
						this.xData.push(this.randomData());
					}
					myChart.setOption(this.option, true);
				},200)
			}
		},
		beforeDestroy() {
			clearInterval(this.timer);
		}
	}
</script>

<style lang="scss" scoped>
	.sn-title{
		text-align: center;
		color: white;
	}
	.wrap-container{
		width: 586px;
		height: 400px;
		.chartsdom{
			width: 100%;
			height: 100%;
		}
	}
</style>
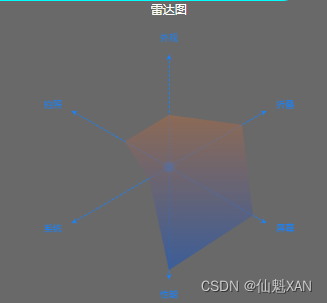
9、雷达图
<template>
	<div class="wrap-container sn-container">
		<div class="sn-content">
			<div class="sn-title">雷达图</div>
			<div class="sn-body">
				<div class="wrap-container">
					<div class="chartsdom" id='chart-radar'></div>
				</div>
			</div>
		</div>
	</div>
</template>

<script>
	export default {
		name: 'radar-chart',
		data() {
			return {
				Option: null,
				timer: null
			}
		},
		mounted() {
			this.getEchart()
		},
		methods: {
			getEchart() {
				let myChart = this.$echarts.init(document.getElementById('chart-radar'))
				this.option = {
					tooltip: {
						trigger: 'axis'
					},
					radar: [{
						indicator: [
							{
								text: '外观',
								max: 100
							},
							{
								text: '拍照',
								max: 100
							},
							{
								text: '系统',
								max: 100
							},
							{
								text: '性能',
								max: 100
							},
							{
								text: '屏幕',
								max: 100
							},
							{
								text: '折叠',
								max: 100
							},
						],
						radius: '75%',
						center: ['50%', '50%'],
						name: {
							textStyle: {
								color: '#1883ff'
							}
						},
						axisTick: {
							show: false
						},
						axisLabel: {
							show: false
						},
						axisLine: {
							show: true,
							symbol: 'arrow',
							symbolSize: [5, 7.5],
							lineStyle: {
							color: '#1883ff',
								type: 'dashed'
							}
						},
						splitArea: {
							show: false
						},
						splitLine: {
							show: false
						}
					}],

					series: [{
						type: 'radar',
						areaStyle: {},
						symbol: 'none',
						itemStyle: {
							normal: {
								areaStyle: {
									type: 'default'
								}
							}
						},
						lineStyle: {
							opacity: 0,
						},
						data: [
							{
								value: [75, 50, 30, 90, 40, 45],
								name: '智能手机',
								itemStyle: {
									normal: {
										color: new this.$echarts.graphic.LinearGradient(0, 0, 0, 1, [{
											offset: 0,
											color: '#9c6b4e'
										}, {
											offset: 1,
											color: '#2a59ac'
										}]),
										lineStyle: {
											color: '#2a59ac'
										}
									}
								}
							},
							// {
							// 	value: [70, 40, 55, 55, 30, 55],
							// 	name: '5G手机',
							// 	itemStyle: {
							// 		normal: {
							// 			color: new this.$echarts.graphic.LinearGradient(0, 0, 0, 1, [{
							// 				offset: 0,
							// 				color: '#0855ca'
							// 			}, {
							// 				offset: 1,
							// 				color: '#36a6c7'
							// 			}]),
							// 			lineStyle: {
							// 				color: '#36a6c7'
							// 			}
							// 		}
							// 	}
							// }
						]

					}]
				}
				myChart.setOption(this.option, true);
				window.addEventListener('resize', () => {
					myChart.resize();
				});

				this.timer = setInterval(()=>{
					let valueArr = this.option.series[0].data[0].value
					for (var i = 0; i < valueArr.length; i++) {
						valueArr[i] = parseInt((Math.random()*100))
					}
					this.option.series[0].data[0].value = valueArr
					myChart.setOption(this.option, true)
				},1000)
			}
		},
		beforeDestroy(){
			clearInterval(this.timer)
		}
	}
</script>

<style lang="scss" scoped>
	.sn-container{
		text-align: center;
		color: white;
	}
	.wrap-container {
		width: 432px;
		height: 400px;

		.chartsdom {
			width: 100%;
			height: 100%;
		}
	}
</style>
10、柱状图和饼图联动

<template>
	<div class="wrap-container sn-container">
		<div class="sn-content">
			<div class="sn-title">柱状和饼状图联动</div>
			<div class="sn-body">
				<div class="wrap-container">
					<div class="chartsdom" id='chart-bar-pie'></div>
				</div>
			</div>
		</div>
	</div>
</template>

<script>
	export default {
		name: 'union-bar-pie',
		data() {
			return {
				option: null,
				dataMap: {}
			}
		},
		mounted() {
			this.getEchart()
		},
		methods: {
			dataFormatter(obj) {
				let pList = ['金融类', '政务类', '医疗类', '互联网类']
				let temp
				for (let y = 2016; y <= 2020; y++) {
					let max = 0;
					let sum = 0;
					temp = obj[y];
					for (let i = 0, l = temp.length; i < l; i++) {
						max = Math.max(max, temp[i]);
						sum += temp[i];
						obj[y][i] = {
							name: pList[i],
							value: temp[i]
						};
					}
					obj[y + 'max'] = Math.floor(max / 100) * 100;
					obj[y + 'sum'] = sum;
				}
				return obj;
			},

			getEchart() {
				let myChart = this.$echarts.init(document.getElementById('chart-bar-pie'));
				let itemStyleJR = {
					color: '#d6d638'
				}
				let itemStyleZW = {
					color: '#00c86c'
				}
				let itemStyleYL = {
					color: '#07d8ff'
				}
				let itemStyleIT = {
					color: '#0c71cf'
				}

				this.dataMap.dataJR = this.dataFormatter({
					//max : 4000,
					2020: [136, 159, 905, 305],
					2019: [124, 145, 562, 285],
					2018: [118, 128, 207, 265],
					2017: [112, 122, 234, 245],
					2016: [101, 110, 804, 225]
				});

				this.dataMap.dataZW = this.dataFormatter({
					//max : 26600,
					2020: [752, 928, 126, 210],
					2019: [388, 840, 707, 208],
					2018: [855, 987, 959, 207],
					2017: [626, 709, 701, 206],
					2016: [509, 892, 201, 205]
				});

				this.dataMap.dataYL = this.dataFormatter({
					//max : 25000,
					2020: [363, 219, 483, 505],
					2019: [600, 438, 123, 405],
					2018: [179, 405, 668, 305],
					2017: [375, 2886, 276, 205],
					2016: [236, 250, 408, 105]
				});

				this.dataMap.dataIT = this.dataFormatter({
					//max : 26600,
					2020: [752, 928, 126, 255],
					2019: [388, 840, 707, 245],
					2018: [855, 987, 959, 235],
					2017: [626, 709, 701, 225],
					2016: [509, 892, 201, 215]
				});

				this.option = {
					baseOption: {
						timeline: {
							axisType: 'category',
							autoPlay: true,
							playInterval: 2000,
							data: ['2016-01-01', '2017-01-01', '2018-01-01', '2019-01-01', '2020-01-01'],
							lineStyle: {
								color: '#179bf1'
							},
							left: 30,
							right: 30,
							bottom: 30,
							label: {
								color: '#2867a8',
								formatter(s) {
									return (new Date(s)).getFullYear();
								}
							},
							checkpointStyle: {
								color: '#01d8ff',
								symbolSize: 10,
								borderColor: 'rgba(1, 216, 255, 0.5)',
								borderWidth: 5,
							},
							controlStyle: {
								showPlayBtn: false,
								borderColor: '#01bde6',
								itemGap: 20
							},
							itemStyle: {
								// color: '#004b85',
								borderColor: '#004b85',
								borderWidth: 1,
								shadowColor: 'rgba(1, 216, 225, 0.5)',
								shadowBlur: 5
							},
							emphasis: {
								label: {
									color: '#01d8ff',
									show: false
								},
								checkpointStyle: {
									color: '#01d8ff',
									borderColor: 'rgba(1, 216, 255, 0.5)',
									borderWidth: 5,
								},
								controlStyle: {
									borderColor: 'rgba(1, 216, 255, 0.5)'
								},
								itemStyle: {
									color: '#01d8ff',
									borderColor: 'rgba(1, 216, 225, 0.5)',
									borderWidth: 5
								}
							}
						},

						// tooltip: {
						//   trigger: 'item'
						// },
						grid: {
							bottom: '30%',
							right: "42%"
						},
						calculable: true,
						xAxis: [{
							type: 'category',
							data: ['金融类', '政务类', '医疗类', '互联网类'],
							splitLine: {
								show: false
							},
							axisTick: {
								show: false
							},
							axisLine: {
								show: true,
								lineStyle: {
									color: '#0084ff',
								}
							},
						}],
						yAxis: [{
							type: 'value',
							name: '区块链应用(个)',
							splitLine: {
								show: false
							},
							axisTick: {
								show: false
							},
							axisLine: {
								show: true,
								lineStyle: {
									color: '#0084ff'
								}
							},
						}],

						series: [{
								name: '联盟链',
								type: 'bar',
								barMaxWidth: 15,
								center: ['20%', '65%'],
								seriesLayoutBy: 'row',
								markPoint: {
									symbol: 'pin',
									itemStyle: {
										normal: {
											color: '#eb9b44',
											shadowColor: '#eb9b44',
											shadowBlur: 15
										}
									},
									data: [{
											type: 'max',
											name: '最大值'
										},
										{
											type: 'min',
											name: '最小值'
										}
									]
								}
								// label: {
								//   show: true,
								//   position: 'top'
								// },
							},
							{
								name: '应用占比',
								type: 'pie',
								center: ['76%', '20%'],
								radius: '28%',
								z: 100
							}
						]
					},

					options: [{
							series: [{
									data: [{
										name: '金融类',
										value: this.dataMap.dataJR['2016sum'],
										itemStyle: itemStyleJR
									}, {
										name: '政务类',
										value: this.dataMap.dataZW['2016sum'],
										itemStyle: itemStyleZW
									}, {
										name: '医疗类',
										value: this.dataMap.dataYL['2016sum'],
										itemStyle: itemStyleYL
									}, {
										name: '互联网类',
										value: this.dataMap.dataIT['2016sum'],
										itemStyle: itemStyleIT
									}],
								},
								{
									data: [{
										name: '金融类',
										value: this.dataMap.dataJR['2016sum'],
										itemStyle: itemStyleJR
									}, {
										name: '政务类',
										value: this.dataMap.dataZW['2016sum'],
										itemStyle: itemStyleZW
									}, {
										name: '医疗类',
										value: this.dataMap.dataYL['2016sum'],
										itemStyle: itemStyleYL
									}, {
										name: '互联网类',
										value: this.dataMap.dataIT['2016sum'],
										itemStyle: itemStyleIT
									}]
								}
							]
						},
						{
							series: [{
									data: [{
										name: '金融类',
										value: this.dataMap.dataJR['2017sum'],
										itemStyle: itemStyleJR
									}, {
										name: '政务类',
										value: this.dataMap.dataZW['2017sum'],
										itemStyle: itemStyleZW
									}, {
										name: '医疗类',
										value: this.dataMap.dataYL['2017sum'],
										itemStyle: itemStyleYL
									}, {
										name: '互联网类',
										value: this.dataMap.dataIT['2017sum'],
										itemStyle: itemStyleIT
									}],
								},
								{
									data: [{
										name: '金融类',
										value: this.dataMap.dataJR['2017sum'],
										itemStyle: itemStyleJR
									}, {
										name: '政务类',
										value: this.dataMap.dataZW['2017sum'],
										itemStyle: itemStyleZW
									}, {
										name: '医疗类',
										value: this.dataMap.dataYL['2017sum'],
										itemStyle: itemStyleYL
									}, {
										name: '互联网类',
										value: this.dataMap.dataIT['2017sum'],
										itemStyle: itemStyleIT
									}]
								}
							]
						},
						{
							series: [{
									data: [{
										name: '金融类',
										value: this.dataMap.dataJR['2018sum'],
										itemStyle: itemStyleJR
									}, {
										name: '政务类',
										value: this.dataMap.dataZW['2018sum'],
										itemStyle: itemStyleZW
									}, {
										name: '医疗类',
										value: this.dataMap.dataYL['2018sum'],
										itemStyle: itemStyleYL
									}, {
										name: '互联网类',
										value: this.dataMap.dataIT['2018sum'],
										itemStyle: itemStyleIT
									}]
								},
								{
									data: [{
										name: '金融类',
										value: this.dataMap.dataJR['2018sum'],
										itemStyle: itemStyleJR
									}, {
										name: '政务类',
										value: this.dataMap.dataZW['2018sum'],
										itemStyle: itemStyleZW
									}, {
										name: '医疗类',
										value: this.dataMap.dataYL['2018sum'],
										itemStyle: itemStyleYL
									}, {
										name: '互联网类',
										value: this.dataMap.dataIT['2018sum'],
										itemStyle: itemStyleIT
									}]
								}
							]
						},
						{
							series: [{
									data: [{
										name: '金融类',
										value: this.dataMap.dataJR['2019sum'],
										itemStyle: itemStyleJR
									}, {
										name: '政务类',
										value: this.dataMap.dataZW['2019sum'],
										itemStyle: itemStyleZW
									}, {
										name: '医疗类',
										value: this.dataMap.dataYL['2019sum'],
										itemStyle: itemStyleYL
									}, {
										name: '互联网类',
										value: this.dataMap.dataIT['2019sum'],
										itemStyle: itemStyleIT
									}]
								},
								{
									data: [{
										name: '金融类',
										value: this.dataMap.dataJR['2019sum'],
										itemStyle: itemStyleJR
									}, {
										name: '政务类',
										value: this.dataMap.dataZW['2019sum'],
										itemStyle: itemStyleZW
									}, {
										name: '医疗类',
										value: this.dataMap.dataYL['2019sum'],
										itemStyle: itemStyleYL
									}, {
										name: '互联网类',
										value: this.dataMap.dataIT['2019sum'],
										itemStyle: itemStyleIT
									}]
								}
							]
						},
						{
							series: [{
									data: [{
										name: '金融类',
										value: this.dataMap.dataJR['2020sum'],
										itemStyle: itemStyleJR
									}, {
										name: '政务类',
										value: this.dataMap.dataZW['2020sum'],
										itemStyle: itemStyleZW
									}, {
										name: '医疗类',
										value: this.dataMap.dataYL['2020sum'],
										itemStyle: itemStyleYL
									}, {
										name: '互联网类',
										value: this.dataMap.dataIT['2020sum'],
										itemStyle: itemStyleIT
									}]
								},
								{
									data: [{
										name: '金融类',
										value: this.dataMap.dataJR['2020sum'],
										itemStyle: itemStyleJR
									}, {
										name: '政务类',
										value: this.dataMap.dataZW['2020sum'],
										itemStyle: itemStyleZW
									}, {
										name: '医疗类',
										value: this.dataMap.dataYL['2020sum'],
										itemStyle: itemStyleYL
									}, {
										name: '互联网类',
										value: this.dataMap.dataIT['2020sum'],
										itemStyle: itemStyleIT
									}]
								}
							]
						}
					]
				}

				myChart.setOption(this.option, true);

				window.addEventListener('resize', () => {
					myChart.resize();
				});
			}
		}
	}
</script>

<style lang="scss" scoped>
	.sn-title {
		text-align: center;
		color: white;
	}

	.wrap-container {
		width: 586px;
		height: 400px;

		.chartsdom {
			width: 100%;
			height: 100%;
		}
	}
</style>
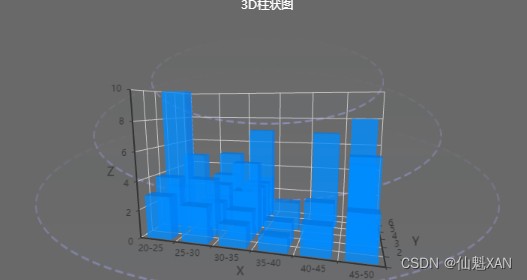
11、3D 柱状图
<template>
	<div class="wrap-container trigle">
		<div class="sn-content">
			<div class="sn-title">3D柱状图</div>
			<div class="sn-body">
				<div class="wrap-container">
					<div class="bar bar-img"></div>
					<div class="bar bar-img1"></div>
					<div class="bar bar-img2"></div>

					<div class="chartsdom" id='chart-3d-bar'></div>
				</div>
			</div>
		</div>
	</div>
</template>

<script>
	import 'echarts-gl'
	export default {
		name: 'three-d-bar',
		data() {
			return {
				option: null
			}
		},

		mounted() {
			this.getEchart()
		},

		methods: {
			getEchart() {
				let myChart = this.$echarts.init(document.getElementById('chart-3d-bar'));
				let xData = ['20-25', '25-30', '30-35', '35-40', '40-45', '45-50'];
				let days = ['1', '2', '3', '4', '5', '6'];
				let sex = ['女', '男'];
				let data = [
					[0, 0, 3, sex[0], xData[0], 500, 25],
					[0, 1, 2.5, sex[0], xData[3], 1000, 35],
					[0, 2, 1.5, sex[1], xData[4], 3000, 5],
					[0, 3, 1, sex[1], xData[1], 300, 15],
					[0, 4, 2, sex[0], xData[2], 500, 55],
					[0, 5, 3, sex[0], xData[3], 1500, 45],

					[1, 5, 6, sex[1], xData[0], 300, 25],
					[1, 1, 4, sex[0], xData[1], 500, 22],
					[1, 2, 2, sex[0], xData[2], 1500, 38],
					[1, 3, 1.5, sex[1], xData[3], 2500, 25],
					[1, 4, 3, sex[0], xData[4], 3500, 49],
					[1, 0, 4, sex[1], xData[5], 5500, 15],

					[2, 2, 3, sex[1], xData[0], 300, 25],
					[2, 1, 2, sex[0], xData[4], 1300, 25],
					[2, 2, 5, sex[0], xData[2], 900, 25],
					[2, 5, 1, sex[1], xData[3], 2000, 25],
					[2, 0, 3, sex[1], xData[1], 2300, 25],
					[2, 0, 10, sex[1], xData[5], 3500, 25],

					[3, 2, 3, sex[0], xData[5], 500, 35],
					[3, 3, 2, sex[0], xData[4], 2300, 55],
					[3, 2, 1, sex[1], xData[3], 3300, 15],
					[3, 5, 5, sex[1], xData[2], 500, 10],
					[3, 1, 2, sex[1], xData[1], 1000, 35],
					[3, 0, 1, sex[0], xData[0], 300, 45],

					[4, 2, 3, sex[1], xData[1], 600, 25],
					[4, 0, 5, sex[0], xData[0], 500, 15],
					[4, 1, 3.5, sex[1], xData[3], 4000, 5],
					[4, 4, 7, sex[0], xData[0], 300, 75],
					[4, 1, 0, sex[1], xData[5], 3000, 85],
					[3, 1, 3, sex[0], xData[2], 2500, 65],

					[5, 2, 3, sex[0], xData[2], 500, 15],
					[5, 1, 2, sex[1], xData[3], 3300, 52],
					[5, 1, 5, sex[0], xData[4], 1000, 88],
					[5, 5, 8, sex[1], xData[0], 200, 12],
					[5, 2, 7, sex[0], xData[0], 300, 45],
					[3, 2, 2, sex[1], xData[1], 5000, 51]
				];

				this.option = {
					tooltip: {
						borderColor: '#8a704e',
						borderWidth: 1,
						padding: 15,
						formatter: (params) => {
							let html =
								`${params.seriesName} <br><span style="color: #f00;"> 性别:${params.value[3]} <br> 年龄:${params.value[4]}岁<br> 贷款金额:${params.value[5]} <br> 总人数:${params.value[6]}</span>`;
							return html;
						},
						textStyle: {
							color: '#8a704e',
							fontSize: 16
						}
					},
					xAxis3D: {
						type: 'category',
						data: xData
					},
					yAxis3D: {
						type: 'category',
						data: days
					},
					zAxis3D: {
						type: 'value'
					},
					grid3D: {
						show: true,
						boxWidth: 160,
						boxDepth: 80,
						viewControl: {
							alpha: 10,
							beta: 15
						}
					},
					series: [{
						type: 'bar3D',
						name: '当前值',
						// data: data,
						data: data.map((item) => {
							return {
								value: [item[1], item[0], item[2], item[3], item[4], item[5], item[6]],
							}
						}),
						shading: 'lambert',
						label: {
							show: false
						},
						itemStyle: {
							color: '#0084ff',
							opacity: 0.8
						},
						emphasis: {
							label: {
								show: false
							},
							itemStyle: {
								color: '#00eeff'
							}
						}
					}]
				}

				myChart.setOption(this.option, true);

				window.addEventListener('resize', () => {
					myChart.resize();
				});
			}

		}
	}
</script>

<style lang="scss" scoped>
	.sn-title{
		text-align: center;
		color: white;
	}
	.wrap-container{
		position: relative;
		width: 620px;
		height: 400px;
		.chartsdom{
			width: 100%;
			height: 100%;
		}

		.bar{
			width: 100%;
			height: 100%;
			position: absolute;
			&.bar-img{
				bottom: 5%;
				background: url(../../assets/img/bk_circle.png) no-repeat center 97%;
				background-size: 100%;
				filter:hue-rotate(180deg)
			}
			&.bar-img1{
				bottom: 35%;
				background: url(../../assets/img/bk_circle1.png) no-repeat center 97%;
				background-size: 75%;
				filter: hue-rotate(180deg);
			}
			&.bar-img2 {
				bottom: 60%;
				background: url(../../assets/img/bk_circle2.png) no-repeat center 97%;
				background-size: 50%;
				filter: hue-rotate(180deg);
			}
		}
	}
</style>
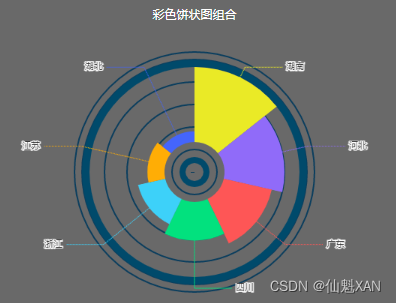
12、彩色饼状图组合
<template>
	<div class="wrap-container sn-container">
		<div class="sn-content">
			<div class="sn-title">彩色饼状图组合</div>
			<div class="sn-body">
				<div class="wrap-container">
					<div class="chartsdom" id='chart-colorful-pies'></div>
				</div>
			</div>
		</div>
	</div>
</template>

<script>
	export default {
		name: 'colorful-pies',
		mounted() {
			this.getEchart()
		},
		methods: {
			getEchart() {
				let myChart = this.$echarts.init(document.getElementById('chart-colorful-pies'))
				let option = {
					color: ['#EAEA26', '#906BF9', '#FE5656', '#01E17E', '#3DD1F9', '#FFAD05', '#4465fc'],
					tooltip: {
						trigger: 'item',
						formatter: '{b} : {c} ({d}%)'
					},
					polar: {},
					angleAxis: {
						interval: 1,
						type: 'category',
						data: [],
						z: 10,
						axisLine: {
							show: false,
							lineStyle: {
								color: '#0B4A6B',
								width: 5,
								type: 'solid'
							},
						},
						axisLabel: {
							interval: 0,
							show: true,
							color: '#0B4A6B',
							margin: 8,
							fontSize: 16
						},
					},
					radiusAxis: {
						min: 40,
						max: 120,
						interval: 15,
						axisLine: {
							show: false,
							lineStyle: {
								color: '#0B3E5E',
								width: 1,
								type: 'solid'
							},
						},
						axisLabel: {
							formatter: '{value} %',
							show: false,
							padding: [0, 0, 20, 0],
							color: '#0B3E5E',
							fontSize: 16
						},
						splitLine: {
							lineStyle: {
								color: '#0B3E5E',
								width: 2,
								type: "solid"
							}
						}
					},
					calculable: true,
					series: [{
							type: 'pie',
							radius: ['6%', '10%'],
							hoverAnimation: false,
							labelLine: {
								normal: {
									show: false,
									length: 30,
									length2: 50
								},
								emphasis: {
									show: false
								}
							},
							tooltip: {
								show: false
							},
							data: [{
								name: '',
								value: 0,
								itemStyle: {
									normal: {
										color: '#004A6B'
									}
								}
							}]
						},
						{
							type: 'pie',
							radius: ['70%', '75%'],
							hoverAnimation: false,
							labelLine: {
								normal: {
									show: false,
									length: 30,
									length2: 50
								},
								emphasis: {
									show: false
								}
							},
							tooltip: {
								show: false
							},
							data: [{
								name: '',
								value: 0,
								itemStyle: {
									normal: {
										color: '#004A6B'
									}
								}
							}]
						},
						{
							stack: 'a',
							type: 'pie',
							radius: ['20%', '70%'],
							roseType: 'area',
							zlevel: 10,
							label: {
								normal: {
									show: true,
									formatter: '{b}',
									textStyle: {
										fontSize: 12,
									},
									position: 'outside'
								},
								emphasis: {
									show: true
								}
							},
							labelLine: {
								normal: {
								show: true,
									length: 15,
									length2: 50,
									lineStyle: {
										type: 'dotted'
									}
								},
								emphasis: {
									show: true
								}
							},
							data: [{
								value: 35,
								name: '湖南'
							}, {
								value: 28,
								name: '河北'
							}, {
								value: 23,
								name: '广东'
							}, {
								value: 18,
								name: '四川'
							}, {
								value: 13,
								name: '浙江'
							}, {
								value: 8,
								name: '江苏'
							}, {
								value: 5,
								name: '湖北'
							}]
						}
					]
				}

				myChart.setOption(option, true);
				window.addEventListener('resize', () => {
					myChart.resize();
				});
			}

		}
	}
</script>

<style lang="scss" scoped>
	.sn-title{
		text-align: center;
		color: white;
	}
	.wrap-container{
		width: 532px;
		height: 400px;
		.chartsdom{
			width: 100%;
			height: 100%;
		}
	}
</style>
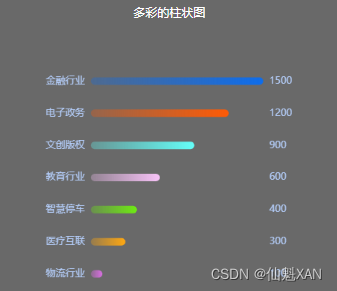
13、多彩柱状图
<template>
	<div class="wrap-container sn-container">
		<div class="sn-content">
			<div class="sn-title">多彩的柱状图</div>
			<div class="sn-body">
				<div class="wrap-container">
					<div class="chartsdom" id='chart-colorful-bar'></div>
				</div>
			</div>
		</div>
	</div>
</template>

<script>
	export default {
		name: 'colorful-bar',

		mounted() {
			this.getEchart()
		},
		methods: {
			getEchart() {
				let myChart = this.$echarts.init(document.getElementById('chart-colorful-bar'))
				let charts = { // 按顺序排列从大到小
					cityList: ['金融行业', '电子政务', '文创版权', '教育行业', '智慧停车', '医疗互联', '物流行业'],
					cityData: [1500, 1200, 900, 600, 400, 300, 100]
				}

				let top10CityList = charts.cityList;
				let top10CityData = charts.cityData;
				// bar 颜色rgba ,alpha 在后边 LinearGradient 补充
				let color = ['rgba(14,109,236', 'rgba(255,91,6', 'rgba(100,255,249', 'rgba(248,195,248', 'rgba(110,234,19',
					'rgba(255,168,17', 'rgba(218,111,227'
				];

				let lineY = [];
				for (let i = 0; i < charts.cityList.length; i++) {
					let x = i
					if (x > color.length - 1) {
						x = color.length - 1
					}
					let data = {
						name: charts.cityList[i],
						color: color[x] + ')',
						value: top10CityData[i],
						itemStyle: {
							normal: {
								show: true,
								color: new this.$echarts.graphic.LinearGradient(0, 0, 1, 0, [{
									offset: 0,
									color: color[x] + ', 0.3)'
								}, {
									offset: 1,
									color: color[x] + ', 1)'
								}], false),
								barBorderRadius: 10
							},
							emphasis: {
								shadowBlur: 15,
								shadowColor: 'rgba(0, 0, 0, 0.1)'
							}
						}
					}

					lineY.push(data)
				}

				// 指定配置和数据
				let option = {
					color: color,
					tooltip: {
						trigger: 'item',
					},
					// 图表网格相对html元素的上下左右边界距离
					grid: {
						borderWidth: 0,
						top: '15%',
						left: '12%',
						right: '12%',
						bottom: '10%',
						containLabel: true
					},
					xAxis: [{
						type: 'value',
						axisTick: {
						show: false
						},
						axisLine: {
							show: false
						},
						splitLine: {
							show: false
						},
						axisLabel: {
							show: false
						}
					}],
					yAxis: [{
						type: 'category',
						inverse: true,
						axisTick: {
							show: false
						},
						axisLine: {
							show: false
						},
						axisLabel: {
							show: true,
							inside: false,
							textStyle: {
								color: '#b3ccf8',
								fontSize: 13
							},
						},
						data: top10CityList
					}, {
						type: 'category',
						axisLine: {
							show: false
						},
						axisTick: {
							show: false
						},
						axisLabel: {
							show: true,
							inside: false,
							textStyle: {
							color: '#b3ccf8',
								fontSize: 13
							},
							formatter: (val) => {
								return `${val}`
							}
						},
						splitArea: {
							show: false
						},
						splitLine: {
							show: false
						},
						data: top10CityData.reverse()
					}],
					series: [{
						name: '',
						type: 'bar',
						zlevel: 2,
						barWidth: '10px',
						data: lineY,
						animationDuration: 1500,
						label: {
							normal: {
							color: '#b3ccf8',
								show: false,
								position: [0, '-15px'],
								textStyle: {
									fontSize: 13
								},
								formatter: (a) => {
									return a.name;
								}
							}
						}
					}]
				};

				// 把配置给实例对象
				myChart.setOption(option, true);
				// 添加窗口尺寸变化监听
				window.addEventListener('resize', () => {
					myChart.resize();
				});
			}
		}

	}
</script>

<style lang="scss" scoped>
	.sn-title{
		text-align: center;
		color: white;
	}
	.wrap-container {
		width: 432px;
		height: 400px;

		.chartsdom {
			width: 100%;
			height: 100%;
		}
	}
</style>