以下我们在arm架构上以Prometheus2.28.1为例来进行一下安装(支持arm和mips)
环境准备
登录后复制
下载安装包
wget https://github.com/prometheus/prometheus/releases/download/v2.28.1/prometheus-2.28.1.linux-arm64.tar.gz
解压
tar -zxvf prometheus-2.28.1.linux-arm64.tar.gz
配置文件讲解
Prometheus 默认的配置文件分为四大块:
global 块:Prometheus 的全局配置
比如 scrape_interval 表示 Prometheus 多久抓取一次数据,evaluation_interval 表示多久检测一次告警规则;
alerting 块:关于 Alertmanager 的配置,这个我们后面再看;
rule_files 块:告警规则,这个我们后面再看;
scrape_config 块:这里定义了 Prometheus 要抓取的目标,我们可以看到默认已经配置了一个名称为 prometheus 的 job,这是因为 Prometheus 在启动的时候也会通过 HTTP 接口暴露自身的指标数据,这就相当于 Prometheus 自己监控自己,虽然这在真正使用 Prometheus 时没啥用处,但是我们可以通过这个例子来学习如何使用 Prometheus;可以访问 http://localhost:9099/metrics
注意:配置文件中的static_configs地址是我们要抓取的目标而不是Prometheus的服务端口
初次测试,不需要配置任何东西,直接启动接口,如果端口被占用可以使用以下命令启动
./prometheus --config.file=prometheus.yml --web.listen-address=:9099
带上&符号后台运行
该参数决定何时删除旧数据,默认为15天。在启动脚本里更改–storage.tsdb.retention=90d可以延长,或者启动时带上这个参数即可。
检测prometheus.yml编写的是否正确
./promtool check config prometheus.yml
返回
#Checking prometheus.yml
SUCCESS: 0 rule files found
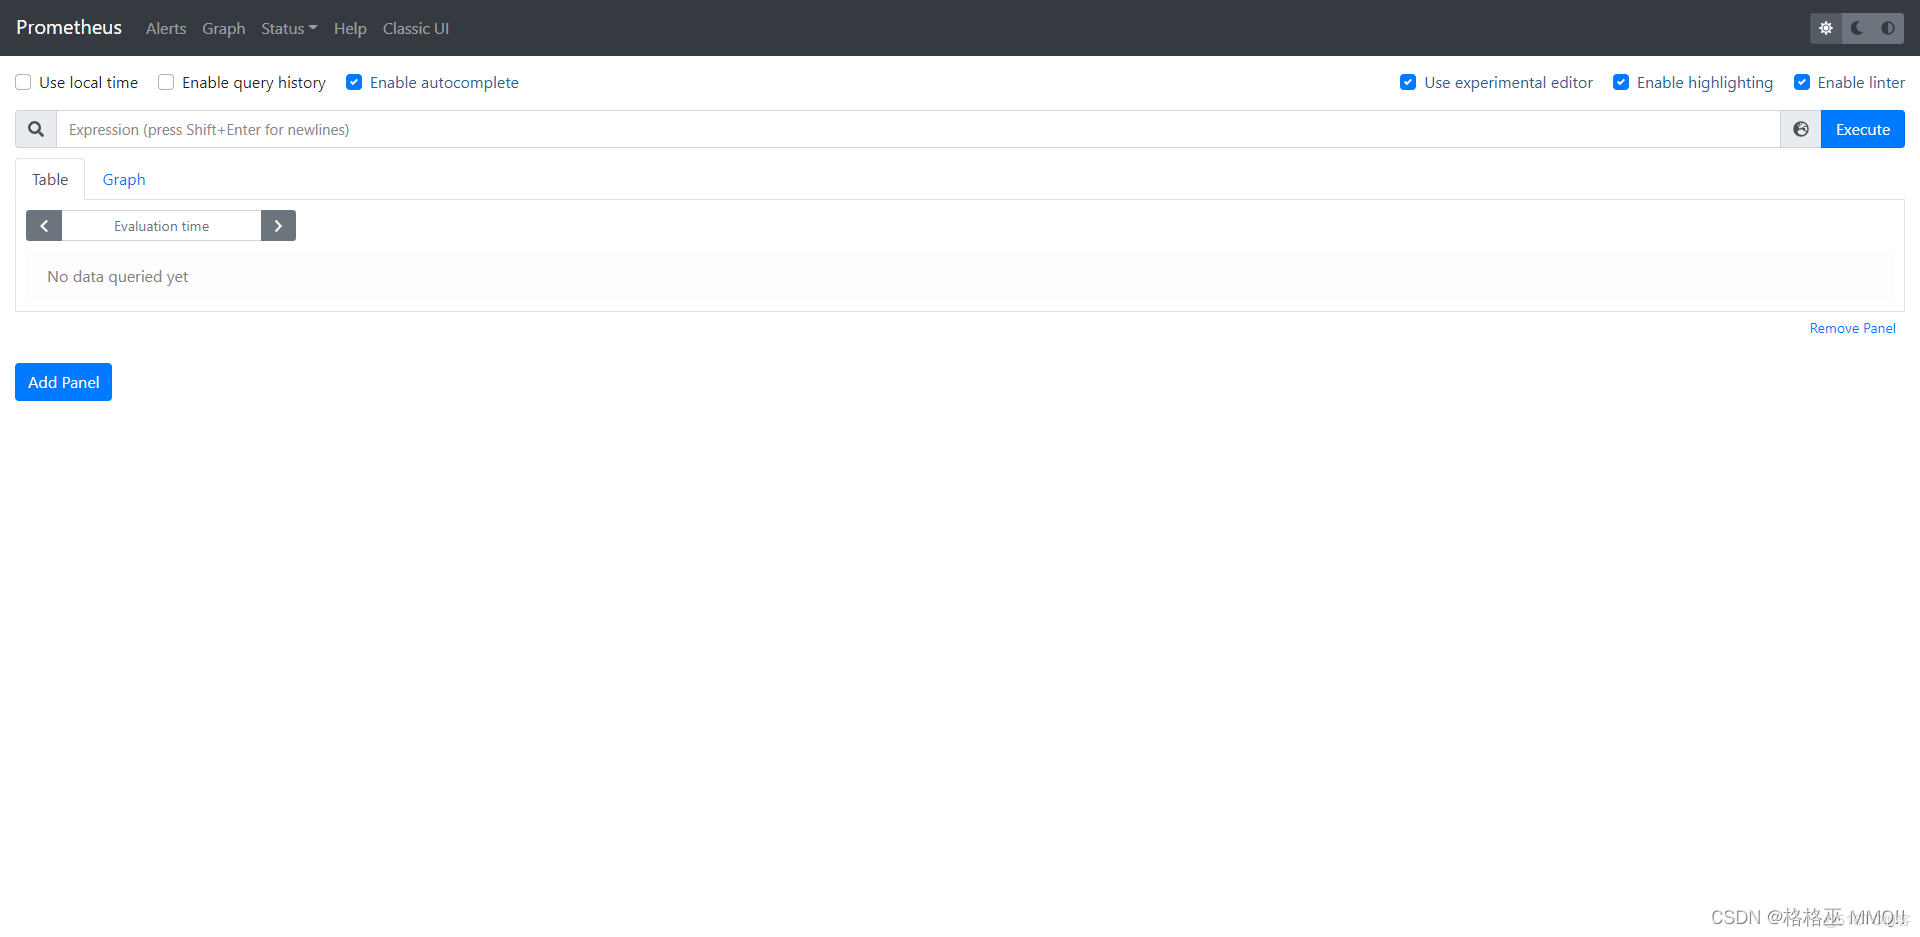
访问地址: http://192.168.5.236:9099/