一、实战场景
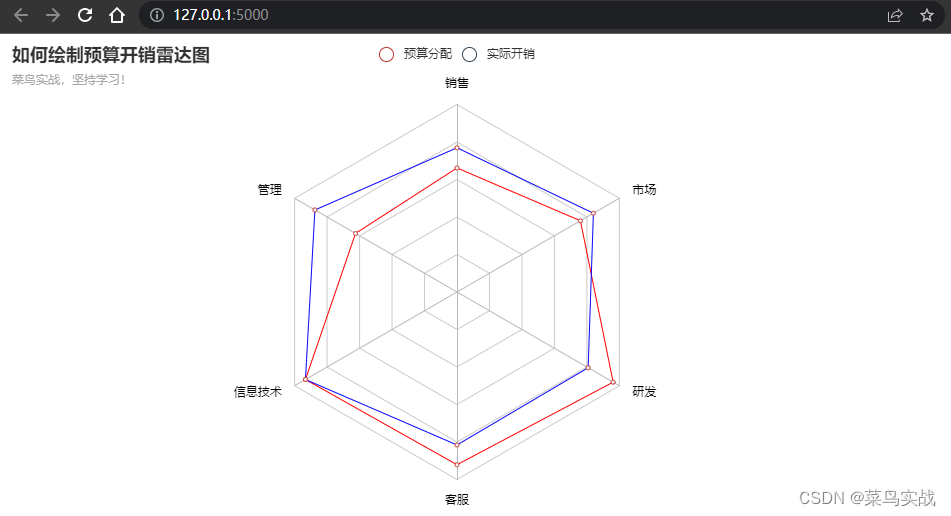
实战场景: 如何绘制预算开销雷达图
二、主要知识点
三、菜鸟实战
马上安排!
1、创建 python 文件
"""
Author: 菜鸟实战
实战场景:  如何绘制预算开销雷达图
"""

# 导入系统包
import platform
from flask import Flask, render_template
from pyecharts import options as opts
from pyecharts.charts import *

print("Hello,菜鸟实战")
print("实战场景:  如何绘制预算开销雷达图 \n")

web = Flask(__name__)

# 构建数据
v1 = [[4300, 10000, 28000, 35000, 50000, 19000]]
v2 = [[5000, 14000, 28000, 31000, 42000, 21000]]


def radar_charts() -> Radar():
    # 实例化对象
    radar = Radar()
    radar.add_schema(
        schema=[
            opts.RadarIndicatorItem(name="销售", max_=6500, color="#000000"),
            opts.RadarIndicatorItem(name="管理", max_=16000, color="#000000"),
            opts.RadarIndicatorItem(name="信息技术", max_=30000, color="#000000"),
            opts.RadarIndicatorItem(name="客服", max_=38000, color="#000000"),
            opts.RadarIndicatorItem(name="研发", max_=52000, color="#000000"),
            opts.RadarIndicatorItem(name="市场", max_=25000, color="#000000"),
        ]
        )
    radar.add(
        series_name="预算分配",
        data=v1,
        linestyle_opts=opts.LineStyleOpts(color="#ff0000"),
    ),
    radar.add(
        series_name="实际开销",
        data=v2,
        linestyle_opts=opts.LineStyleOpts(color="#0000ff"),
    ),

    # 隐藏数值
    radar.set_series_opts(label_opts=opts.LabelOpts(is_show=False)),

    # 全局置标题、标签
    radar.set_global_opts(
        title_opts=opts.TitleOpts(title="如何绘制预算开销雷达图", subtitle="菜鸟实战,坚持学习!"),

    )
    return radar


# 获取对象
p = radar_charts()
# 绘制图形。path为指定路径,生成HTML文件的一个路径
p.render('./templates/radar_charts.html')


# 添加路由显示图表
@web.route('/')
def index():
    return render_template('radar_charts.html')


if __name__ == "__main__":
    # 运行项目
    web.run(debug=False)

print("Python 版本", platform.python_version())
2、运行结果
Hello,菜鸟实战
实战场景: 如何绘制预算开销雷达图* Serving Flask app 'py040' (lazy loading)
* Environment: production
WARNING: This is a development server. Do not use it in a production deployment.
Use a production WSGI server instead.
* Debug mode: off
* Running on http://127.0.0.1:5000 (Press CTRL+C to quit)
菜鸟实战,持续学习!