前言
Spring MVC与Spring Webflux对比
实验对比结果
Spring web MVC
5000个request, 并发每次是100个,用时26.244 seconds
Spring-webflux
5000个request, 并发每次是100个,用时26.269 seconds
总结
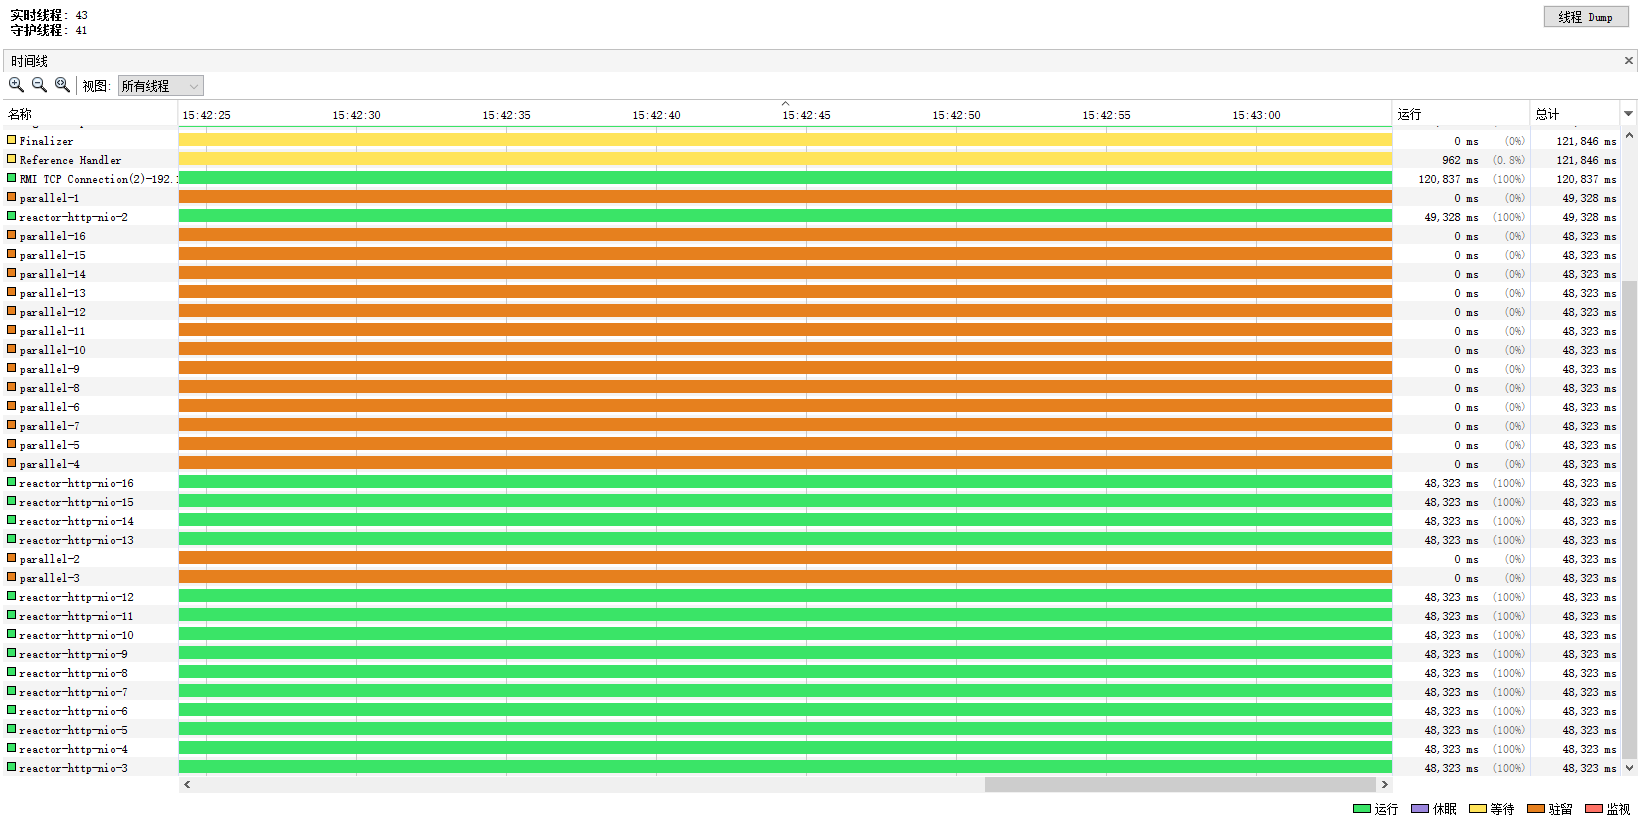
总时间上来,差别不大,webmvc是26.244 seconds,而webflux是26.269 seconds,启动线程差别很大,webmvc最高峰时118个,webflux一直是47个。 其它CPU和堆的使用也差别不大。
使用undertow做嵌入式服务的spring mvc , 用时26.177 seconds,可以看出undertow性能上面的确比tomcat要强。
实验步骤
1. spring_web_mvc 项目
pom.xml
<dependency>
	<groupId>org.springframework.boot</groupId>
	<artifactId>spring-boot-starter-web</artifactId>
</dependency>
Spring boot application类
@SpringBootApplication
public class SpringWebMvc {
    public static void main(String[] args) {
        SpringApplication.run(SpringWebMvc.class, args);
    }
}
RestController
@RestController
public class SyncController {
    @GetMapping("/sync_result")
    public String getResultAsyc(HttpServletRequest request) {
    	try {
			Thread.sleep(500);
		} catch (InterruptedException e) {
			e.printStackTrace();
		}
    	return "Result is ready! threadName:" + Thread.currentThread().getName();
    }
}
项目启动之后,运行jvisualvm.exe监控Thread,CPU,Heap..
用CMD运行下面命令启动apache ab,开始压力测试
ab -n 5000 -c 100 localhost:8080/sync_result
apache ab运行结果
Concurrency Level: 100
Time taken for tests: 26.244 seconds
Complete requests: 5000
Failed requests: 0
Total transferred: 745000 bytes
HTML transferred: 80000 bytes
Requests per second: 190.52 [#/sec] (mean)
Time per request: 524.878 [ms] (mean)
Time per request: 5.249 [ms] (mean, across all concurrent requests)
Transfer rate: 27.72 [Kbytes/sec] received
Connection Times (ms)
min mean[+/-sd] median max
Connect: 0 0 0.3 0 1
Processing: 500 512 5.7 514 635
Waiting: 500 511 5.6 513 624
Total: 500 512 5.7 514 635
Percentage of the requests served within a certain time (ms)
50% 514
66% 515
75% 516
80% 516
90% 517
95% 518
98% 520
99% 523
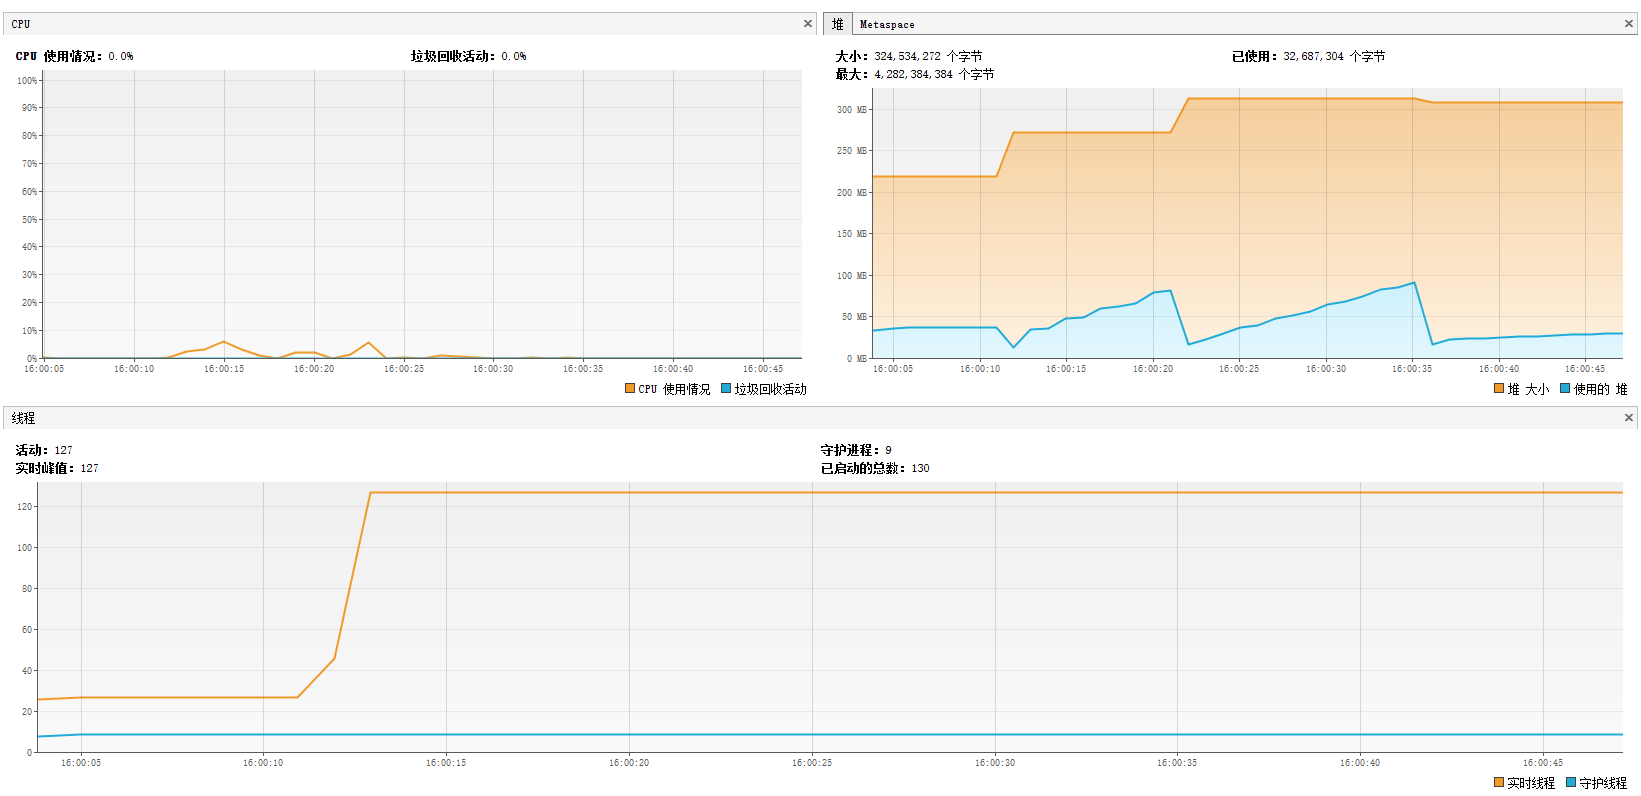
100% 635 (longest request)jvisualvm上的性能检测结果

2. spring_webflux 项目
pom.xml
   		<dependency>
			<groupId>org.springframework.boot</groupId>
			<artifactId>spring-boot-starter-webflux</artifactId>
		</dependency>
application class
@SpringBootApplication
public class SpringWebFlux {
    public static void main(String[] args) {
        SpringApplication.run(SpringWebFlux.class, args);
    }
}
RestController
@RestController
public class WebFluxController {

    @GetMapping("/flux_result")
    public Mono getResult(ServerHttpRequest request) {
       return Mono.defer(() -> Mono.just("Result is ready!" + Thread.currentThread().getName()))
         .delaySubscription(Duration.ofMillis(500));
    }
}
压力测试的运行结果
ab -n 5000 -c 100 localhost:8080/flux_result Concurrency Level: 100
Time taken for tests: 26.269 seconds
Complete requests: 5000
Failed requests: 2187
(Connect: 0, Receive: 0, Length: 2187, Exceptions: 0)
Total transferred: 497187 bytes
HTML transferred: 142187 bytes
Requests per second: 190.34 [#/sec] (mean)
Time per request: 525.386 [ms] (mean)
Time per request: 5.254 [ms] (mean, across all concurrent requests)
Transfer rate: 18.48 [Kbytes/sec] received
Connection Times (ms)
min mean[+/-sd] median max
Connect: 0 0 0.3 0 1
Processing: 500 511 7.6 513 643
Waiting: 500 510 7.3 511 633
Total: 500 511 7.6 513 643
Percentage of the requests served within a certain time (ms)
50% 513
66% 515
75% 516
80% 516
90% 518
95% 522
98% 532
99% 535
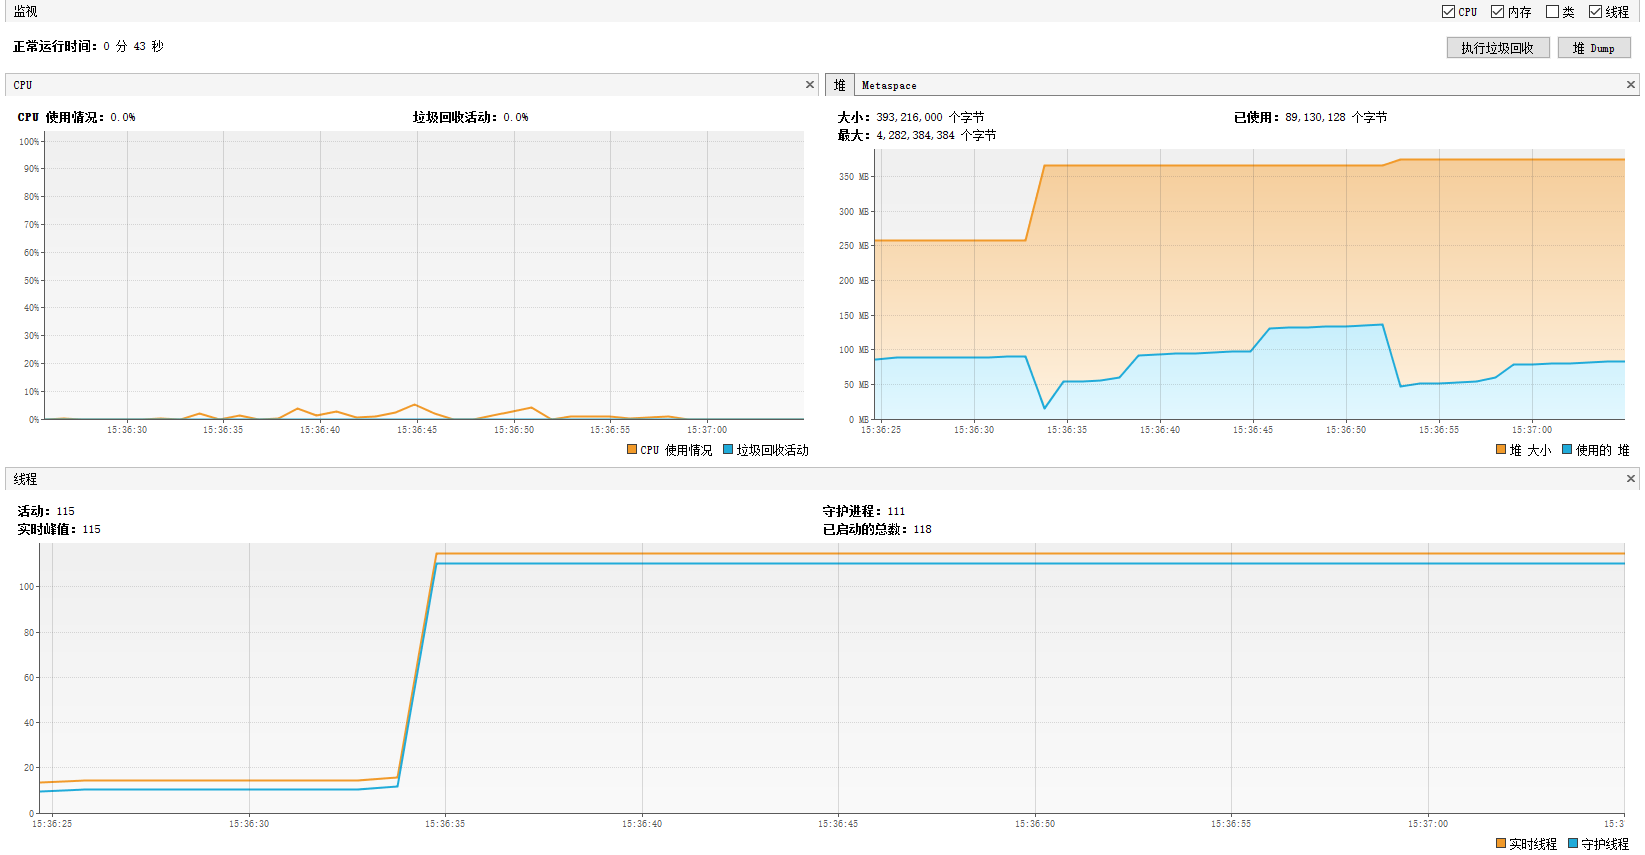
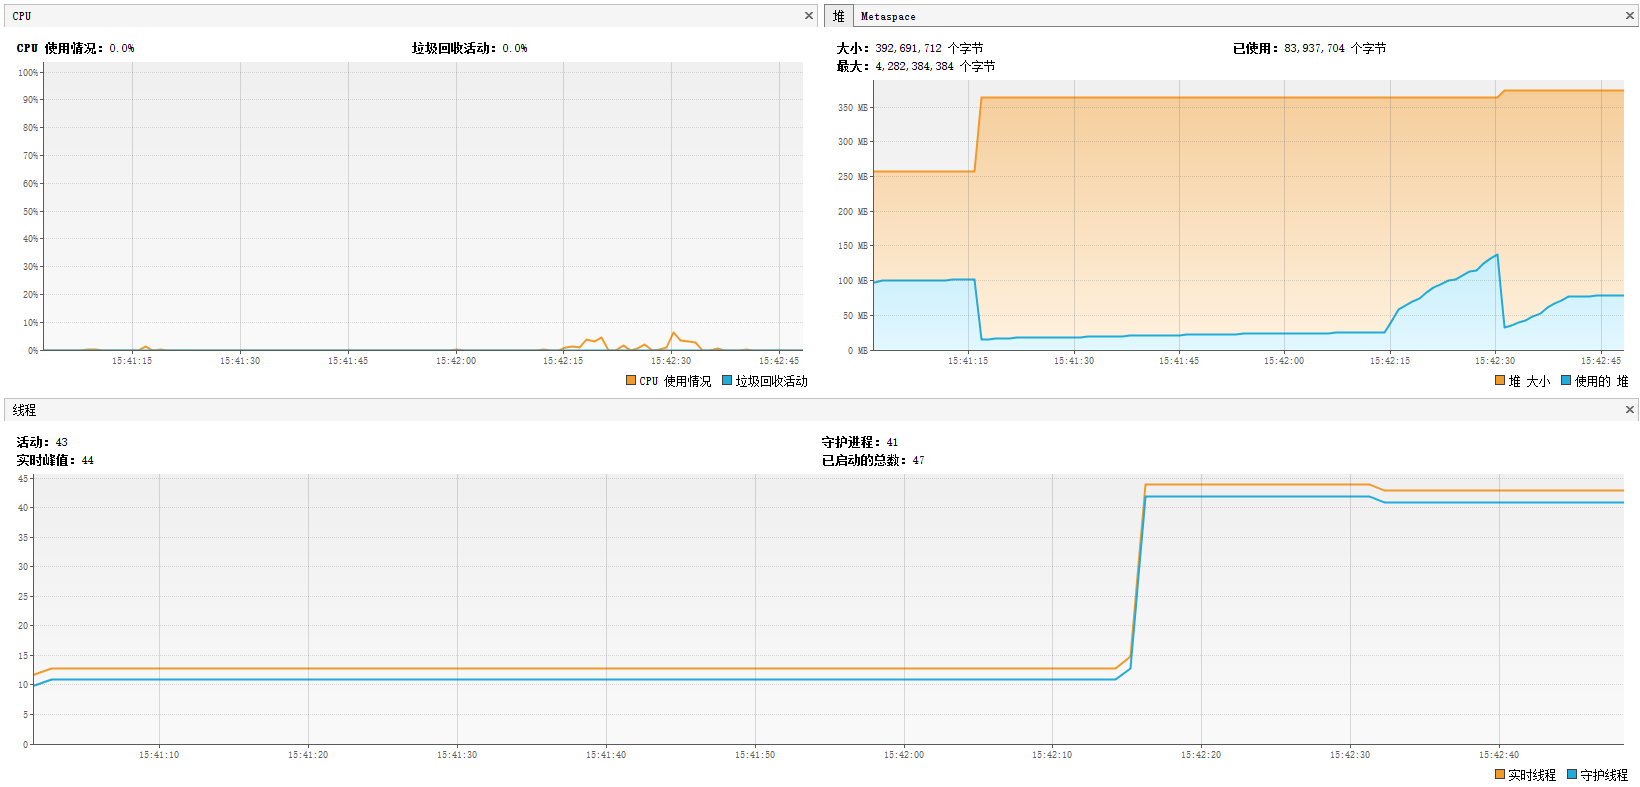
100% 643 (longest request)jvisualvm上的性能检测结果
webflux 会根据cpu的数量启动线程。我CPU信息:内核:8,逻辑处理器:16。
3. 利用undertow做嵌入式服务的spring mvc
在spring mvc的项目的基础上做以下修改
		<dependency>
			<groupId>org.springframework.boot</groupId>
			<artifactId>spring-boot-starter-web</artifactId>
			<exclusions>
                <exclusion>
                    <groupId>org.springframework.boot</groupId>
                    <artifactId>spring-boot-starter-tomcat</artifactId>
                </exclusion>
            </exclusions>
		</dependency>
		<dependency>
            <groupId>org.springframework.boot</groupId>
            <artifactId>spring-boot-starter-undertow</artifactId>
        </dependency>
运行
ab -n 5000 -c 100 localhost:8080/sync_result
Concurrency Level:      100
Time taken for tests:   26.177 seconds
Complete requests:      5000
Failed requests:        0
Total transferred:      755000 bytes
HTML transferred:       80000 bytes
Requests per second:    191.01 [#/sec] (mean)
Time per request:       523.532 [ms] (mean)
Time per request:       5.235 [ms] (mean, across all concurrent requests)
Transfer rate:          28.17 [Kbytes/sec] received

Connection Times (ms)
              min  mean[+/-sd] median   max
Connect:        0    0   0.3      0       1
Processing:   500  510   6.3    512     603
Waiting:      500  509   6.1    511     592
Total:        500  510   6.3    512     604

Percentage of the requests served within a certain time (ms)
  50%    512
  66%    514
  75%    515
  80%    515
  90%    516
  95%    517
  98%    519
  99%    533
 100%    604 (longest request)
jvisualvm上的性能检测结果