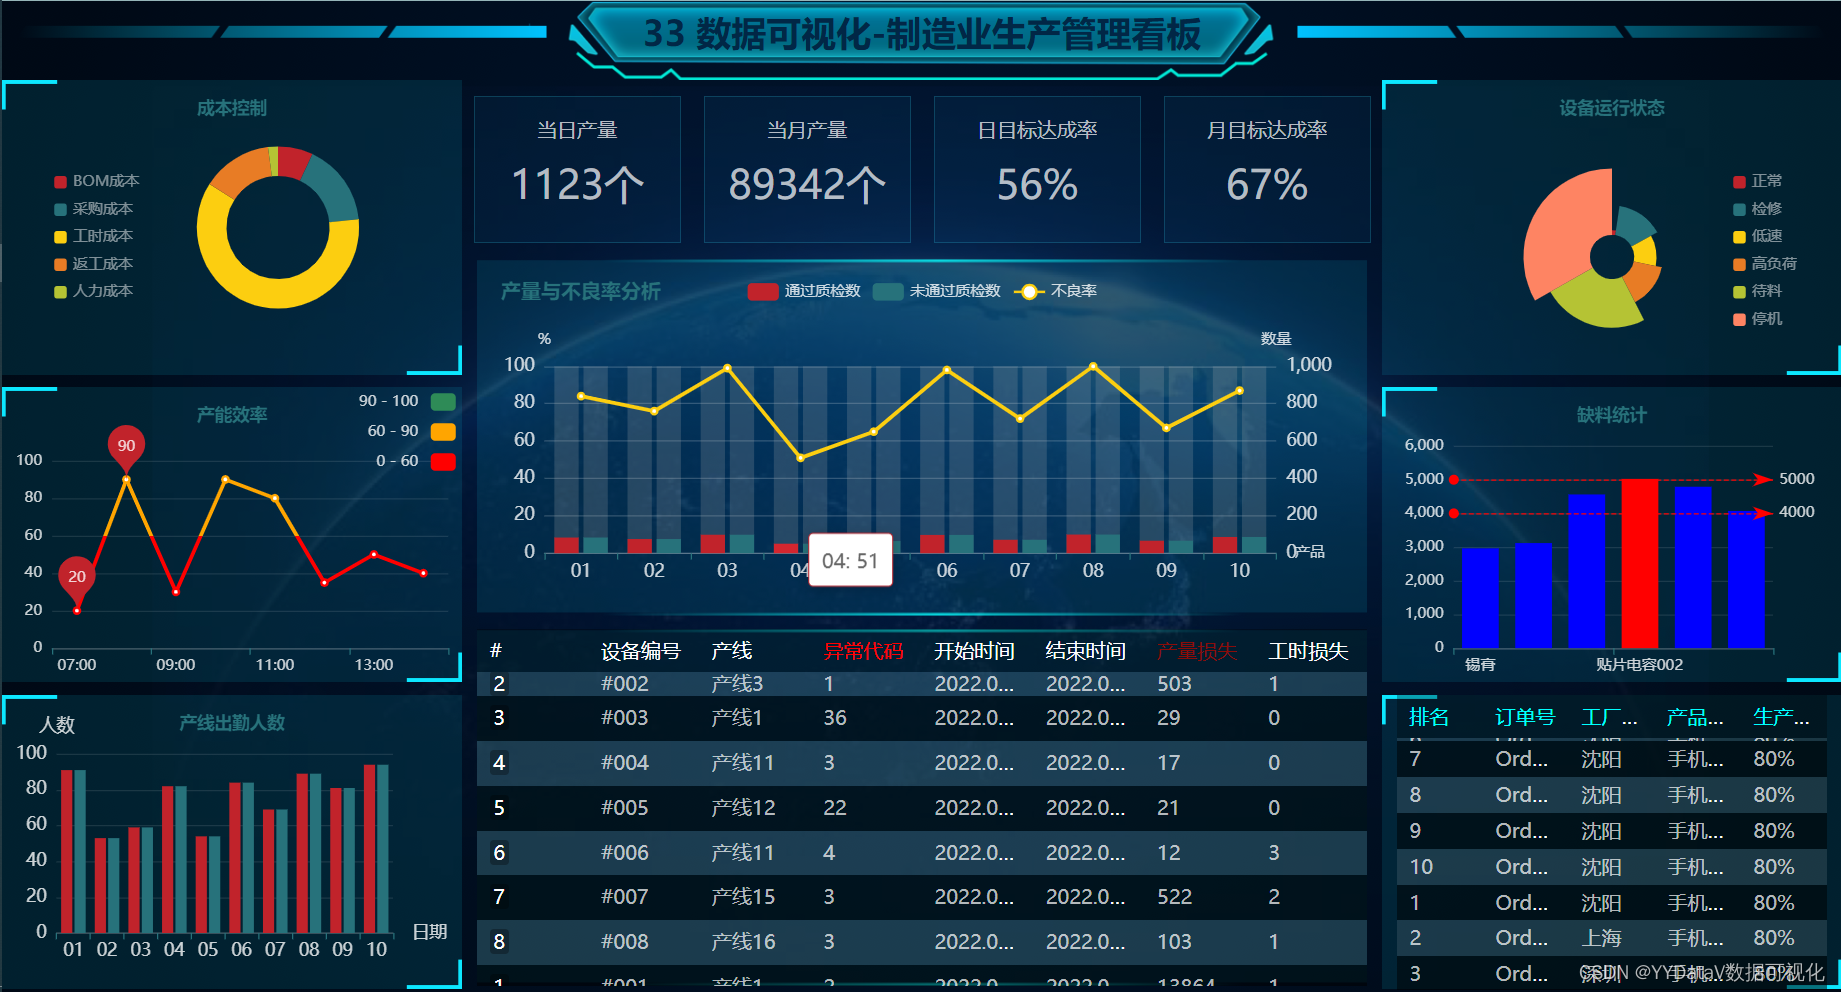
效果展示
1.动态实时更新数据效果图
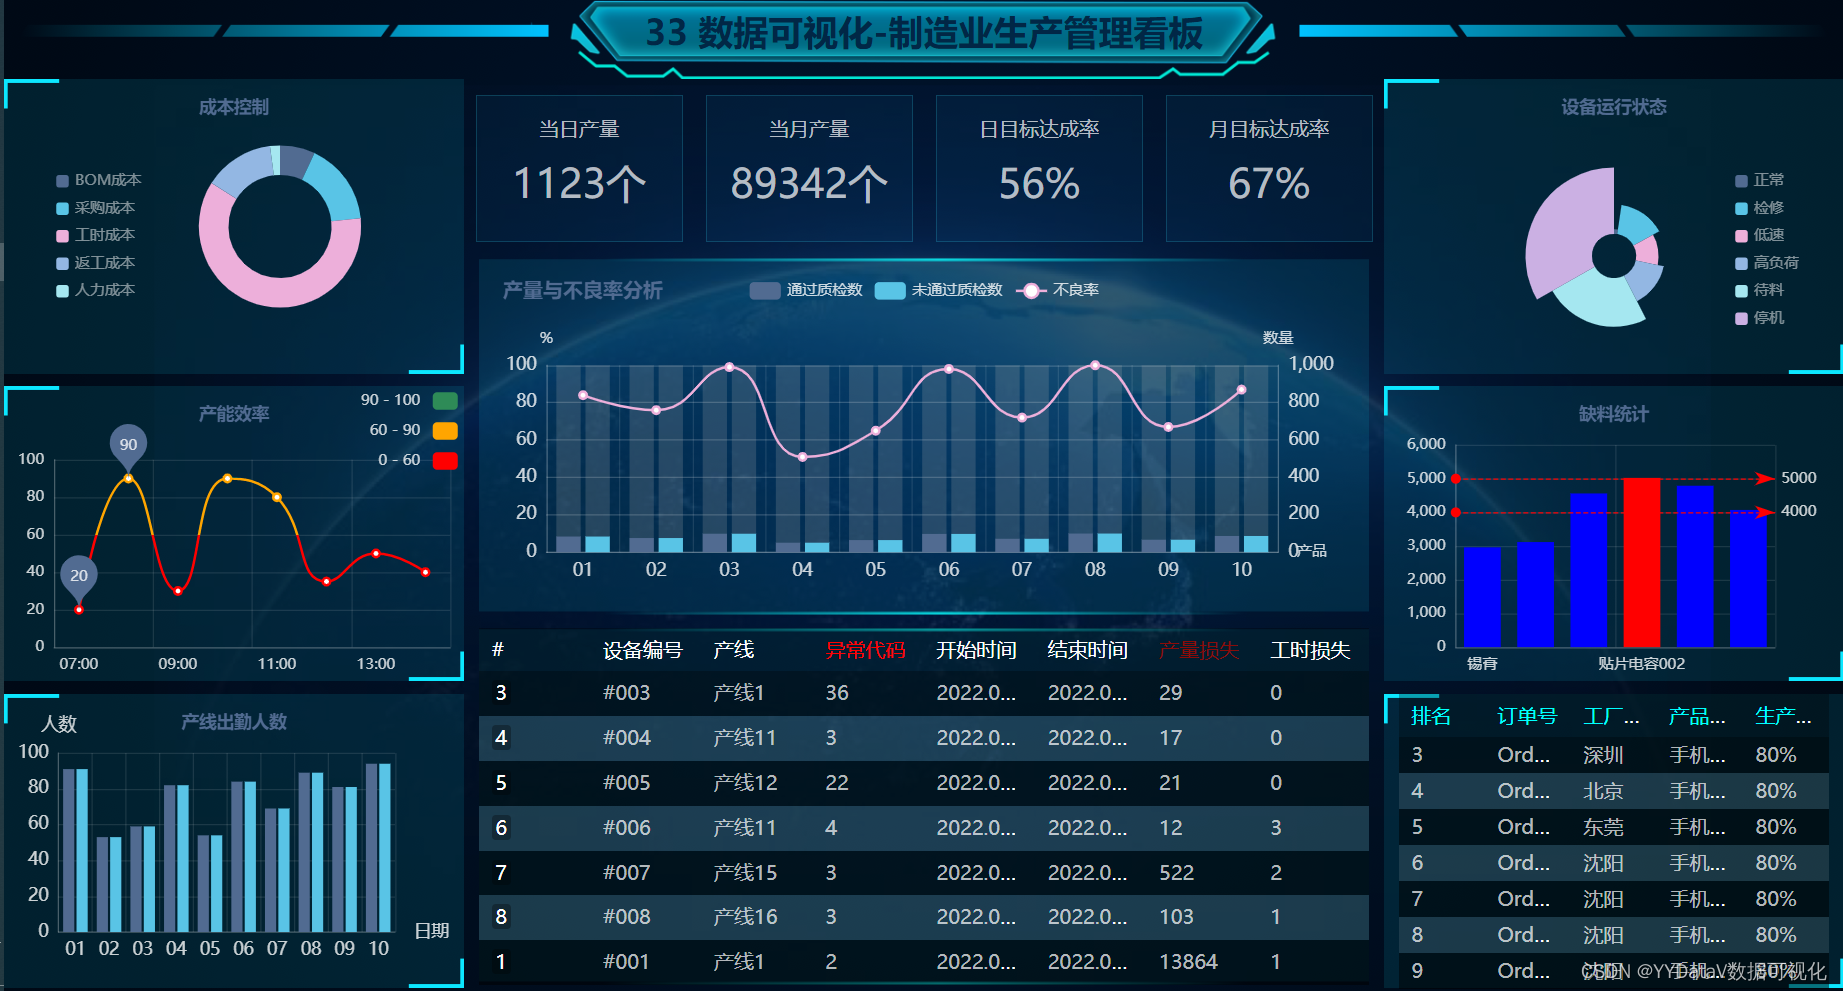
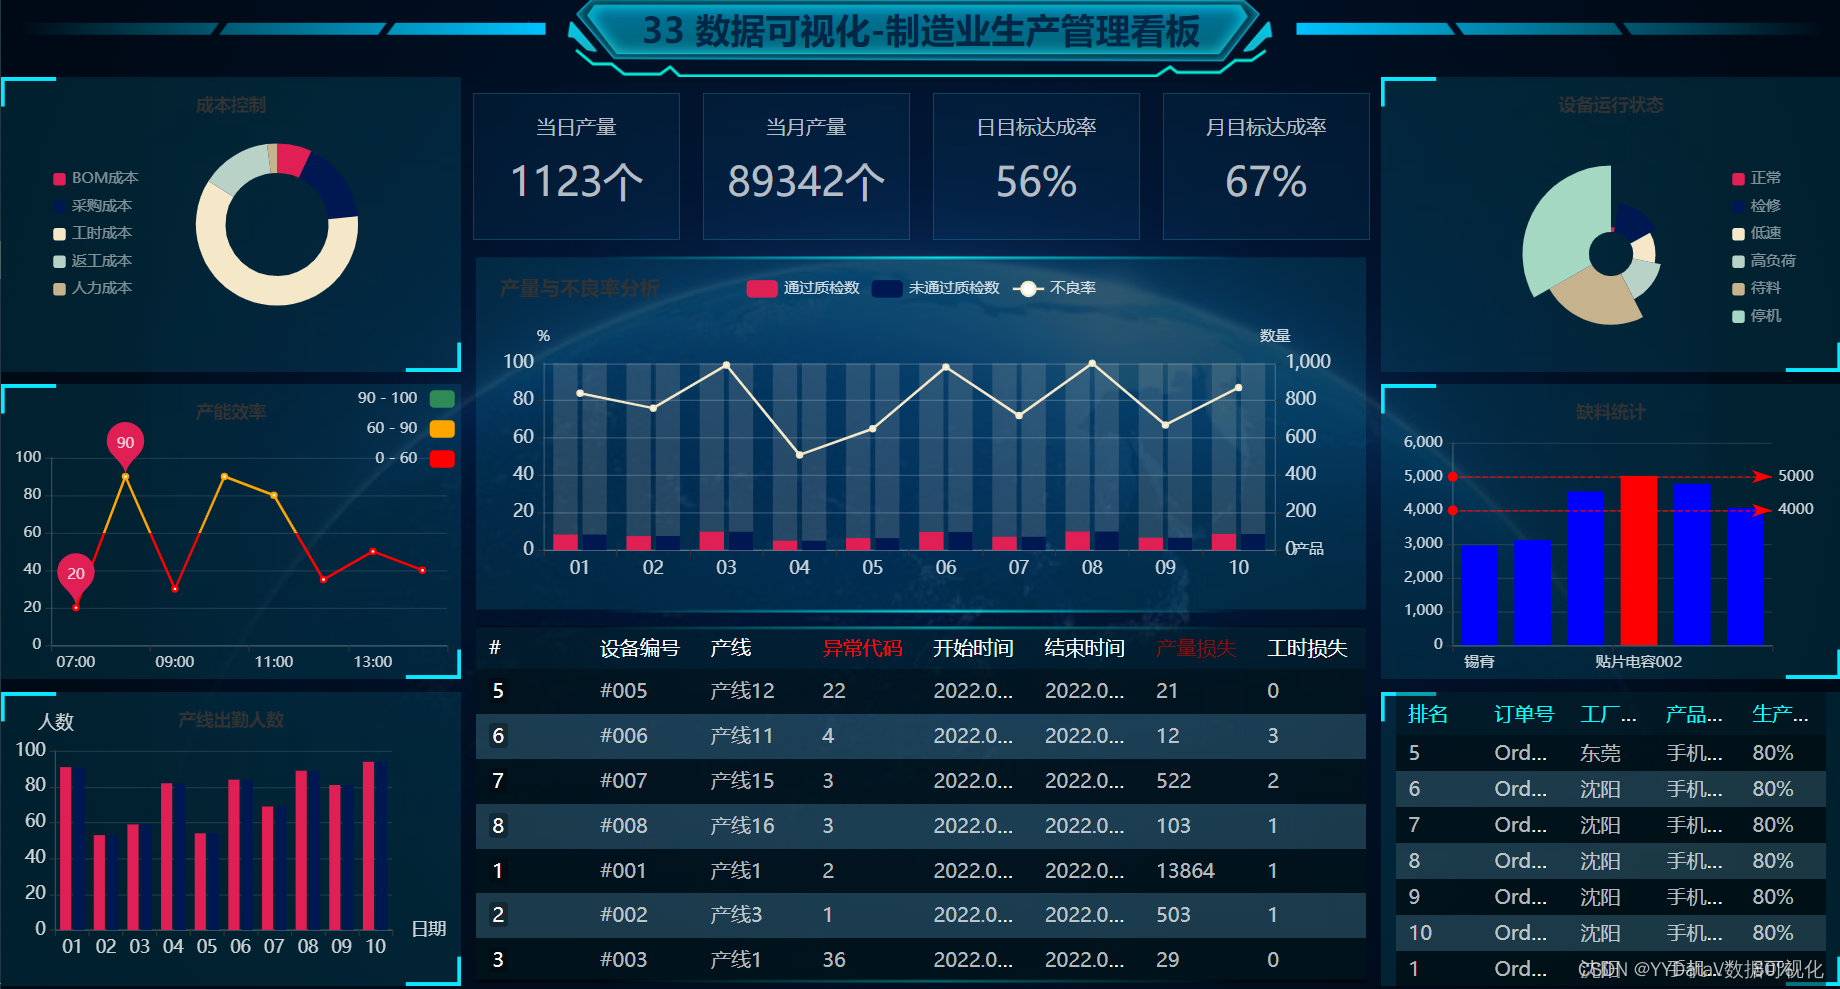
2.鼠标右键切换主题
一.确定需求方案
1. 屏幕分辨率
这个案例的分辨率是16:9,最常用的的宽屏比。
根据电脑分辨率屏幕自适应显示,F11全屏查看;
2. 部署方式
B/S方式:支持Windows、Linux、Mac等各种主流操作系统;支持主流浏览器Chrome,Microsoft Edge,360等;服务器采用python语言编写,配置好python环境即可。
二. 整体架构设计
- 前端Echarts开源库:使用 WebStorm 编辑器;
- 后端 http服务器:基于 Python 实现,使用 Pycharm 或 VSCode 编辑器;
- 数据传输格式:JSON;
- 数据源类型:JSON文件。实际开发需求中,支持定制HTTP API接口方式或其它各种类型数据库,如PostgreSQL、MySQL、Oracle、Microsoft SQL Server、SQLite、Excel表格等。
- 数据更新方式:采用http get 轮询方式 。在实际应用中,也可以视情况选择j监测后端数据实时更新,实时推送到前端的方式;
三.编码实现 (基于篇幅及可读性考虑,此处展示部分关键代码)
1. 前端html代码
本次页面布局使用BootStrap,操作灵活,方便扩展。
<div class="container-fluid">
        <!-- 标题栏 -->
        <div class="row_fluid">
            <div id="container_0" class="col-12">
            </div>
        </div>
        <!-- 外框 在row这里设置样式-->
        <div class="row" style="height: 90%; ">
            <!-- 左侧 -->
            <div class="col-3" style="height: 100%;">
                <!-- 左侧第1行 -->
                <div class="row" id="container_l1">
                </div>
                <!-- 左侧第2行 -->
                <div class="row" id="container_l2">
                </div>
                <!-- 左侧第3行 -->
                <div class="row" id="container_l3">
                </div>
            </div>
            <!-- 中间 -->
            <div class="col-6" style="height:100%;">
                <div>
                    <!-- 中间第一行 -->
                    <div class="row" id="container_m1">
                        <div class="col-3" id="container_m1_1"></div>
                        <div class="col-3" id="container_m1_2"></div>
                        <div class="col-3" id="container_m1_3"></div>
                        <div class="col-3" id="container_m1_4"></div>
                    </div>
                    <!-- 中间第二行 -->
                    <div class="row-fluid" id="container_m2">
                    </div>
                    <!-- 中间第三行 -->
                    <div class="row-fluid" id="container_m3">
                        <dv-scroll-board id="vue_app_1" :config="config" />
                    </div>
                </div>
            </div>

            <!-- 右侧 -->
            <div class="col-3" style="height:100%;">
                <!-- 右侧第一行 -->
                <div class="row" id="container_r1">
                </div>
                <!-- 右侧第二行 -->
                <div class="row" id="container_r2">
                </div>
                <!-- 右侧第三行 -->
                <div class="row" id="container_r3">
                    <dv-scroll-board id="vue_app_2" :config="config" />
                </div>
            </div>
        </div>
布局效果 
2. 前端JS - echarts图表
function init_echart_bar_multi_series(container) {
  var chartDom = document.getElementById(container);
  var myChart = echarts.init(chartDom, window.gTheme);
  var option;

  option = {
    title: {
      text: "产线出勤人数",
      top: "5%",
      left: "center",
      textStyle: {
        // color: "#00ffff",
        fontSize: "14",
      },
    },
    grid: {
      left: "3%",
      right: "15%",
      bottom: "10%",
      top: "20%",
      containLabel: true,
    },
    tooltip: {
      trigger: "item",
      formatter: "{b}: {c}",
      position: function (p) {
        //其中p为当前鼠标的位置
        return [p[0] + 10, p[1] - 10];
      },
    },
    xAxis: {
      name: "日期",
      type: "category",
      nameTextStyle: {
        color: "rgba(255,255,255,.8)",
        fontSize: 14,
      },
      data: [],
      axisLabel: {
        textStyle: {
          color: "rgba(255,255,255,.8)",
          fontSize: 14,
        },
      },
      axisLine: {
        lineStyle: {
          color: "rgba(255,255,255,.2)",
        },
      },
      splitLine: {
        lineStyle: {
          color: "rgba(255,255,255,.1)",
        },
      },
    },
    yAxis: {
      name: "人数",
      type: "value",
      nameTextStyle: {
        color: "rgba(255,255,255,.8)",
        fontSize: 14,
      },
      axisLabel: {
        textStyle: {
          color: "rgba(255,255,255,.8)",
          fontSize: 14,
        },
      },
      axisLine: {
        lineStyle: {
          color: "rgba(255,255,255,.2)",
        },
      },
      splitLine: {
        lineStyle: {
          color: "rgba(255,255,255,.1)",
        },
      },
    },
    series: [
      {
        name: "出勤人数",
        data: [],
        type: "bar",
        // showBackground: true,
        // backgroundStyle: {
        //   color: "rgba(180, 180, 180, 0.2)",
        // },
      },
      {
        name: "缺勤人数",
        data: [],
        type: "bar",
        // showBackground: true,
        // backgroundStyle: {
        //   color: "rgba(180, 180, 180, 0.2)",
        // },
      },
    ],
  };

  option && myChart.setOption(option);
  window.addEventListener("resize", function () {
    myChart.resize();
  });
}
3. 前端JS - 数据定时更新控制
支持在每个echarts图表中独立控制定时更新的间隔。
function async_echart_bar_multi_series(container, filename) {
  $.getJSON(filename).done(function (data) {
    var myChart = echarts.init(
      document.getElementById(container),
      window.gTheme
    );
    myChart.setOption(data);
  }); //end $.getJSON
}
4. 数据传输格式 - JSON 定义
{
    "xAxis": {
        "data": [
            "01",
            "02",
            "03",
            "04",
            "05",
            "06",
            "07",
            "08",
            "09",
            "10"
        ]
    },
    "series": [
        {
            "data": [
                91,
                53,
                59,
                82,
                54,
                84,
                69,
                89,
                81,
                94
            ]
        },
        {
            "data": [
                91,
                53,
                59,
                82,
                54,
                84,
                69,
                89,
                81,
                94
            ]
        }
    ]
}
5. 后端 flask 服务器
from flask import Flask
app = Flask(__name__, static_folder="static", template_folder="template")


# 主程序在这里
if __name__ == "__main__":

    # 开启线程,触发动态数据
    a = threading.Thread(target=asyncJson.loop)
    a.start()

    # 开启 flask 服务
    app.run(host='0.0.0.0', port=88, debug=True)
四. 启动命令
<!-- 启动server命令 -->
python main.py

<!-- 浏览器中输入网址查看大屏(端口为 main.py 中的 port 参数定义) -->
http://localhost:88/static/index.html

<!-- 更多资料参考我的博客主页  -->
https://yydatav.blog.csdn.net/

<!-- 更多案例参考 -->
https://blog.csdn.net/lildkdkdkjf/article/details/120705616

我的微信号:6550523  欢迎多多交流
五. 运行效果

六. 源码下载
33【源码】数据可视化:基于Echarts+PythonFlask动态实时大屏-制造业生产管理看板.zip-企业管理文档类资源-CSDN下载
更多案例
YYDatav的数据可视化大屏《精彩案例汇总》(Python&Echarts源码)_YYDataV的博客-CSDN博客
《工厂订单出入库信息管理系统》完整案例详解(含演示网址账号)(Go&Vue源码)_YYDataV的博客-CSDN博客
本次分享结束,欢迎讨论!QQ微信同号: 6550523