本专栏将从基础开始,循序渐进的讲解Vue的基本概念以及使用,希望大家都能够从中有所收获,也请大家多多支持。
专栏地址: Vue专栏
相关软件地址: 相关安装包地址
如果文章知识点有错误的地方,请指正!大家一起学习,一起进步。
1 ElementUI
官方地址:https://element.eleme.io/#/zh-CN
1.1 安装
cnpm i element-ui -S
1.2 使用
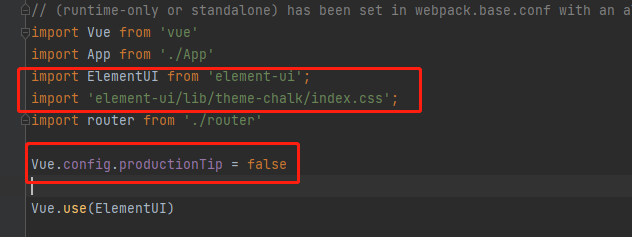
- 完整引入
import ElementUI from 'element-ui';
import 'element-ui/lib/theme-chalk/index.css';
Vue.use(ElementUI)
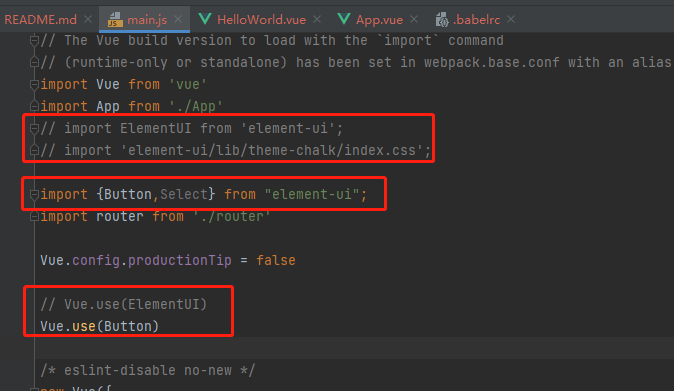
- 按需引入(一般使用这种方式)
- 首先,安装 babel-plugin-component:
cnpm install babel-plugin-component -D
- 然后,将 .babelrc 修改为:
{


  "presets": [
    ["env", {


      "modules": false,
      "targets": {


        "browsers": ["> 1%", "last 2 versions", "not ie <= 8"]
      }
    }],
    "stage-2"
  ],
  "plugins": ["transform-vue-jsx", "transform-runtime",[
    "component",
    {


      "libraryName": "element-ui",
      "styleLibraryName": "theme-chalk"
    }
  ]]
}
对main.js做如下修改,然后需要用什么组件就import哪个组件
2 iView
官方地址:https://iview.github.io/
3 swiper滑动组件
github:https://github.com/surmon-china/vue-awesome-swiper
swiper中文:https://www.swiper.com.cn/demo/web/index.html
- 安装:
//swiper版本换为 5.4.5 , 5.4.5版本较之其他更加稳定
cnpm install [email protected] --save
cnpm install vue-awesome-swiper --save
- 引入并使用
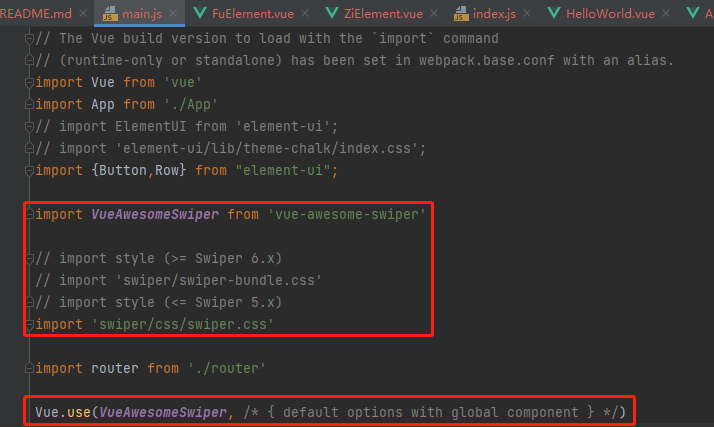
- 全局注册
import Vue from 'vue'
import VueAwesomeSwiper from 'vue-awesome-swiper'

// import style (>= Swiper 6.x)
//import 'swiper/swiper-bundle.css'

// import style (<= Swiper 5.x)
import 'swiper/css/swiper.css'

Vue.use(VueAwesomeSwiper, /* { default options with global component } */)
- 局部注册
import {

     Swiper, SwiperSlide, directive } from 'vue-awesome-swiper'

// import style (>= Swiper 6.x)
import 'swiper/swiper-bundle.css'

// import style (<= Swiper 5.x)
import 'swiper/css/swiper.css'

export default {


  components: {


    Swiper,
    SwiperSlide
  },
  directives: {


    swiper: directive
  }
}
- 使用
<template>

  <div class="fu" >
    <swiper class="mySwiper" ref="mySwiper" :options="swiperOptions">
      <swiper-slide>Slide 1</swiper-slide>
      <swiper-slide>Slide 2</swiper-slide>
      <swiper-slide>Slide 3</swiper-slide>
      <swiper-slide>Slide 4</swiper-slide>
      <swiper-slide>Slide 5</swiper-slide>
      <div class="swiper-pagination" slot="pagination"></div>
    </swiper>
  </div>
</template>

<script>
import ZiElement from "./ZiElement";
import HelloWorld from "./HelloWorld";


export default {
  name: "FuElement",
  components:{
    HelloWorld,
    ZiElement,
  },
  data(){
    return {
      swiperOptions: {
        pagination: {
          el: '.swiper-pagination',
          // Some Swiper option/callback...
          clickable:true,
        },
        autoplay: {
          disableOnInteraction: false,
          delay: 2000,
        },
      }
    }
  },
  computed: {
    swiper() {
      return this.$refs.mySwiper.$swiper
    }
  },
  mounted() {
    this.swiper.slideTo(3, 1000, false)
  },

}
</script>

<style scoped>
.mySwiper{
  height: 50px;
  background-color: aquamarine;
}

</style>
效果如下:

3.1 swiper滑动图片案例
效果如下:

代码如下:
<template>

  <div class="fu" >
    <swiper ref="mySwiper" :options="swiperOptions">
      <swiper-slide v-for="(slide,index) in imgs" :key="index">
        <img :src="slide.image" alt="">
      </swiper-slide>
      <div class="swiper-pagination" slot="pagination"></div>
    </swiper>
  </div>
</template>

<script>
import ZiElement from "./ZiElement";
import HelloWorld from "./HelloWorld";


export default {


  name: "FuElement",
  components:{


    HelloWorld,
    ZiElement,
  },
  data(){


    return {


      swiperOptions: {


        pagination: {


          el: '.swiper-pagination',
          // Some Swiper option/callback...
          clickable:true,
        },
        autoplay: {


          disableOnInteraction: false,
          delay: 2000,
        },
      },
      imgs:[
        {


          desc:'aaa',
          image:"https://cdn.stocksnap.io/img-thumbs/960w/autumn-lake_QQTVFKZ1WR.jpg",
        },
        {


          desc:'bbb',
          image:"https://cdn.stocksnap.io/img-thumbs/960w/fall-leaves_MKRJKUSIPC.jpg"
        }
      ]
    }
  },
  computed: {


    swiper() {


      return this.$refs.mySwiper.$swiper
    }
  },
  // mounted() {


  //   this.swiper.slideTo(3, 1000, false)
  // },

}
</script>

<style scoped>

img{


  width: 100%;
  height: 400px;
}
</style>
4 vue常用组件
组件入口地址:官网https://cn.vuejs.org/
使用:
- 选择想用的组件,然后安装,这里以echart为例作为示范
https://github.com/ambit-tsai/echarts-for-vue
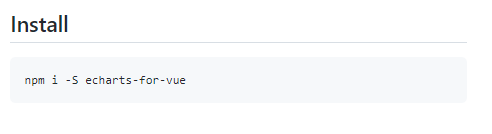
cnpm i -S echarts-for-vue
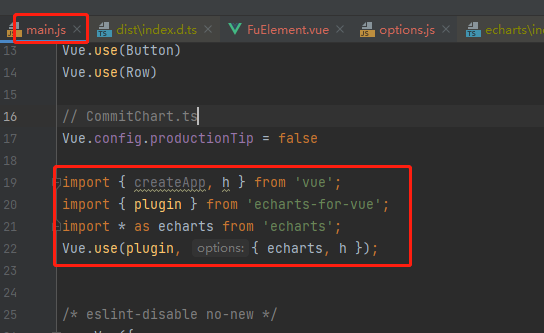
- 添加组件
官方文档:
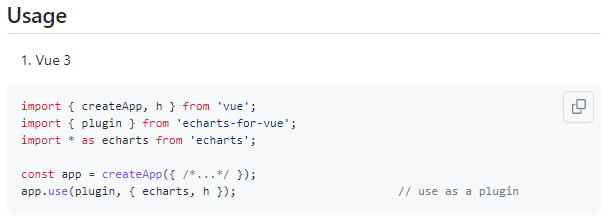
项目中使用:
-
组件中使用
官方文档:
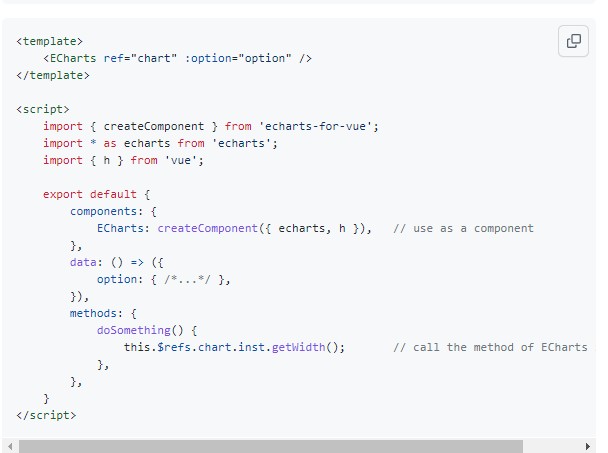
项目中使用:
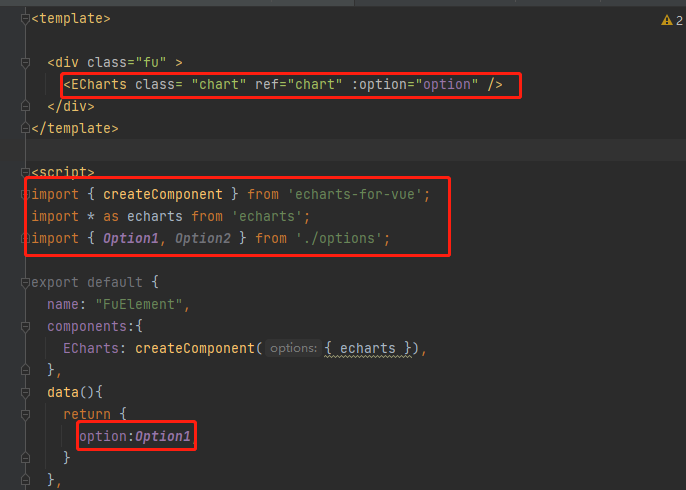
详细代码如下:
<template>

  <div class="fu" >
    <ECharts class= "chart" ref="chart" :option="option" />
  </div>
</template>

<script>
import {

     createComponent } from 'echarts-for-vue';
import * as echarts from 'echarts';
import {

     Option1, Option2 } from './options';

export default {


  name: "FuElement",
  components:{


    ECharts: createComponent({

     echarts }),
  },
  data(){


    return {


      option:Option1,
    }
  },
  computed: {


    swiper() {


      return this.$refs.mySwiper.$swiper
    }
  }
}
</script>

<style scoped>

img{


  width: 100%;
  height: 200px;
}

.chart{


  height: 200px;
  overflow: hidden;
  -webkit-tap-highlight-color: transparent;
  user-select: none;
  position: relative;
}

.fu{


  height: 300px;
}
</style>
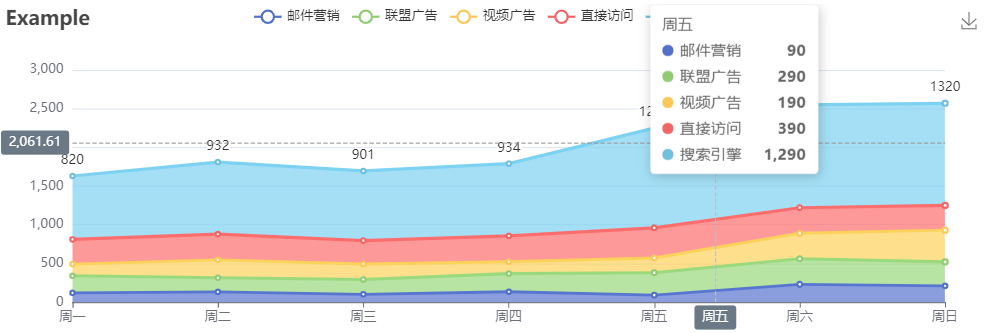
option结构:
export const Option1 = Object.freeze({


  title: {


    text: 'Example'
  },
  tooltip: {


    trigger: 'axis',
    axisPointer: {


      type: 'cross',
      label: {


        backgroundColor: '#6a7985'
      }
    }
  },
  legend: {


    data: ['邮件营销', '联盟广告', '视频广告', '直接访问', '搜索引擎']
  },
  toolbox: {


    feature: {


      saveAsImage: {

    }
    }
  },
  grid: {


    left: '3%',
    right: '4%',
    bottom: '3%',
    containLabel: true
  },
  xAxis: [
    {


      type: 'category',
      boundaryGap: false,
      data: ['周一', '周二', '周三', '周四', '周五', '周六', '周日']
    }
  ],
  yAxis: [
    {


      type: 'value'
    }
  ],
  series: [
    {


      name: '邮件营销',
      type: 'line',
      stack: '总量',
      areaStyle: {

    },
      data: [120, 132, 101, 134, 90, 230, 210]
    },
    {


      name: '联盟广告',
      type: 'line',
      stack: '总量',
      areaStyle: {

    },
      data: [220, 182, 191, 234, 290, 330, 310]
    },
    {


      name: '视频广告',
      type: 'line',
      stack: '总量',
      areaStyle: {

    },
      data: [150, 232, 201, 154, 190, 330, 410]
    },
    {


      name: '直接访问',
      type: 'line',
      stack: '总量',
      areaStyle: {

    },
      data: [320, 332, 301, 334, 390, 330, 320]
    },
    {


      name: '搜索引擎',
      type: 'line',
      stack: '总量',
      label: {


        show: true,
        position: 'top',
      },
      areaStyle: {

    },
      data: [820, 932, 901, 934, 1290, 1330, 1320]
    }
  ]
});


export const Option2 = Object.freeze({


  tooltip: {


    trigger: 'axis',
    axisPointer: {


      type: 'cross',
      crossStyle: {


        color: '#999'
      }
    }
  },
  toolbox: {


    feature: {


      dataView: {

    show: true, readOnly: false},
      magicType: {

    show: true, type: ['line', 'bar']},
      restore: {

    show: true},
      saveAsImage: {

    show: true}
    }
  },
  legend: {


    data: ['蒸发量', '降水量', '平均温度']
  },
  xAxis: [
    {


      type: 'category',
      data: ['1月', '2月', '3月', '4月', '5月', '6月', '7月', '8月', '9月', '10月', '11月', '12月'],
      axisPointer: {


        type: 'shadow'
      }
    }
  ],
  yAxis: [
    {


      type: 'value',
      name: '水量',
      min: 0,
      max: 250,
      interval: 50,
      axisLabel: {


        formatter: '{value} ml'
      }
    },
    {


      type: 'value',
      name: '温度',
      min: 0,
      max: 25,
      interval: 5,
      axisLabel: {


        formatter: '{value} °C'
      }
    }
  ],
  series: [
    {


      name: '蒸发量',
      type: 'bar',
      data: [2.0, 4.9, 7.0, 23.2, 25.6, 76.7, 135.6, 162.2, 32.6, 20.0, 6.4, 3.3]
    },
    {


      name: '降水量',
      type: 'bar',
      data: [2.6, 5.9, 9.0, 26.4, 28.7, 70.7, 175.6, 182.2, 48.7, 18.8, 6.0, 2.3]
    },
    {


      name: '平均温度',
      type: 'line',
      yAxisIndex: 1,
      data: [2.0, 2.2, 3.3, 4.5, 6.3, 10.2, 20.3, 23.4, 23.0, 16.5, 12.0, 6.2]
    }
  ]
});
结果展示:
详细代码地址:https://gitee.com/codinginn/public-code-storage/tree/master/testelemntui