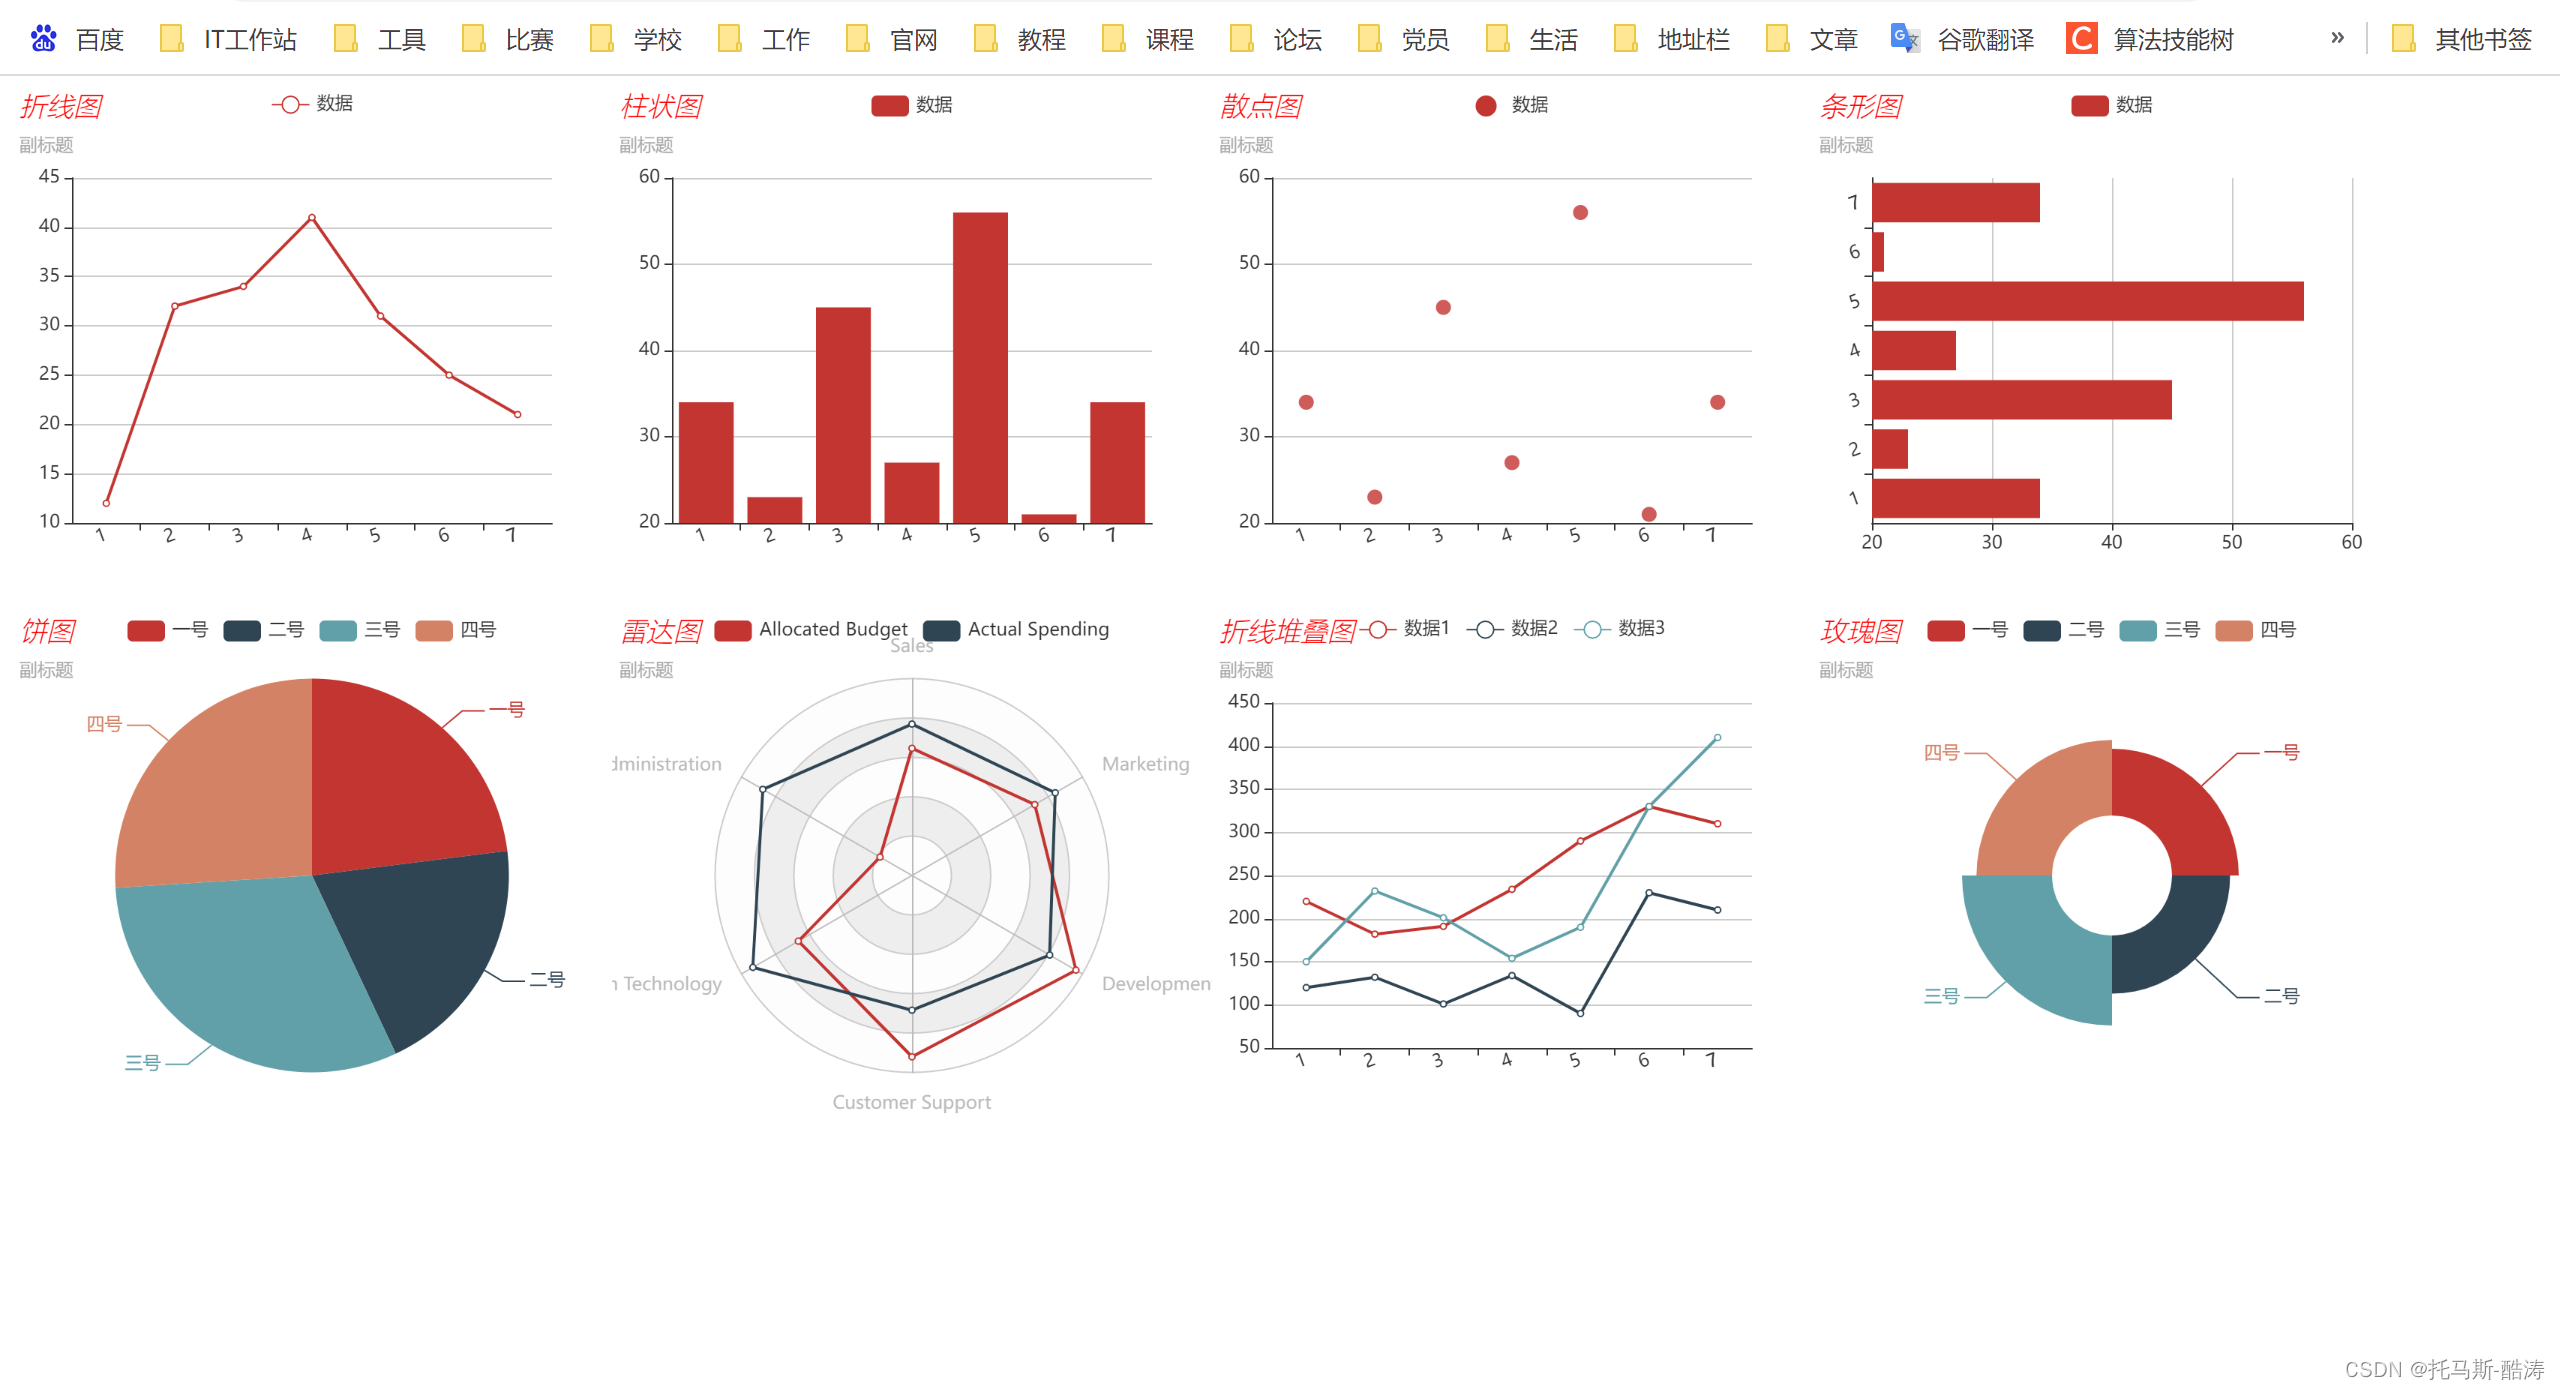
折线图、柱状图、散点图、条形图、饼图、雷达图、折线堆叠图、玫瑰图(8图表)
目录
折线图
<script>
    var myCharts = echarts.init(document.getElementById("main1"))
    option = {
        title:{
            text: '折线图',
            textStyle:{
                color: 'red',
                fontWeight:'lighter',
                fontStyle:'italic'
            },
            subtext:'副标题'
        },
        legend: {},
        tooltip: {
            trigger : 'axis',
            axisPointer:{
                type: 'cross'
            }
        },
        xAxis:{
            type:'category',
            data: [1,2,3,4,5,6,7],
            axisLabel:{
                interval:0,
                rotate:20
            }
        },
        yAxis:{
            type: 'value',
            scale: true
        },
        series:{
            name:'数据',
            type: 'line',
            data:[12,32,34,41,31,25,21]
        }
    };
    myCharts.setOption(option);

</script>
柱状图
<script>
    var myChart1 = echarts.init(document.getElementById("main2"));
    option = {
        title: {
            text: '柱状图',
            textStyle :{
                color : 'red',
                fontWeight: 'lighter',
                fontStyle: 'italic'
            },
            subtext: '副标题'
        },
        legend: {},
        tooltip: {
            trigger : 'axis',
            axisPointer:{
                type: 'cross'
            }
        },
        xAxis:{
            type:'category',
            data: [1,2,3,4,5,6,7],
            axisLabel:{
                interval: 0,
                rotate: 20
            }
        },
        yAxis: {
            type: 'value',
            scale: true
        },
        series:[
        {
            name: '数据',
            type: 'bar',
            data: [34,23,45,27,56,21,34]
        }
        ]
    };
    myChart1.setOption(option);
</script>
散点图
<script>
    var myChart2 = echarts.init(document.getElementById("main3"));
    option = {
        title: {
            text: '散点图',
            textStyle :{
                color : 'red',
                fontWeight: 'lighter',
                fontStyle: 'italic'
            },
            subtext: '副标题'
        },
        legend: {},
        tooltip: {
            trigger : 'axis',
            axisPointer:{
                type: 'cross'
            }
        },
        xAxis:{
            type:'category',
            data: [1,2,3,4,5,6,7],
            axisLabel:{
                interval: 0,
                rotate: 20
            }
        },
        yAxis: {
            type: 'value',
            scale: true
        },
        series:[
        {
            name: '数据',
            type: 'scatter',
            data: [34,23,45,27,56,21,34]
        }
        ]
    };
    myChart2.setOption(option);
</script>
条形图
<script>
    var myChart3 = echarts.init(document.getElementById("main4"));
    option = {
        title: {
            text: '条形图',
            textStyle :{
                color : 'red',
                fontWeight: 'lighter',
                fontStyle: 'italic'
            },
            subtext: '副标题'
        },
        legend: {},
        tooltip: {
            trigger : 'axis',
            axisPointer:{
                type: 'cross'
            }
        },
        yAxis:{
            type:'category',
            data: [1,2,3,4,5,6,7],
            axisLabel:{
                interval: 0,
                rotate: 20
            }
        },
        xAxis: {
            type: 'value',
            scale: true
        },
        series:[
        {
            name: '数据',
            type: 'bar',
            data: [34,23,45,27,56,21,34]
        }
        ]
    };
    myChart3.setOption(option);
</script>
饼图
<script>
    var myChart4 = echarts.init(document.getElementById("main5"));
    option = {
        title: {
            text: '饼图',
            textStyle :{
                color : 'red',
                fontWeight: 'lighter',
                fontStyle: 'italic'
            },
            subtext: '副标题'
        },
        legend: {},
        tooltip: {
            trigger : 'item',
            formatter: '{a}<br />{b}:{c}({d}%)'
        },
        series:[
        {
            name: '数据',
            type: 'pie',
            data: [
            {value:23,name:'一号'},
            {value:20,name:'二号'},
            {value:31,name:'三号'},
            {value:26,name:'四号'}
            ]
        }
        ]
    };
    myChart4.setOption(option);
</script>
雷达图
    <script>
    var myChart5 = echarts.init(document.getElementById("main6"));
    option = {
        title: {
            text: '雷达图',
            textStyle :{
                color : 'red',
                fontWeight: 'lighter',
                fontStyle: 'italic'
            },
            subtext: '副标题'
        },
        legend: {},
        tooltip: {
            trigger : 'item',
            formatter: '{a}<br />{b}:{c}({d}%)'
        },
        radar: {
        shape: 'circle',
        indicator: [
          { name: 'Sales', max: 6500 },
          { name: 'Administration', max: 16000 },
          { name: 'Information Technology', max: 30000 },
          { name: 'Customer Support', max: 38000 },
          { name: 'Development', max: 52000 },
          { name: 'Marketing', max: 25000 }
        ]
        },
        series: [
        {
          name: 'Budget vs spending',
          type: 'radar',
          data: [
            {
              value: [4200, 3000, 20000, 35000, 50000, 18000],
              name: 'Allocated Budget'
            },
            {
              value: [5000, 14000, 28000, 26000, 42000, 21000],
              name: 'Actual Spending'
            }
          ]
        }
        ]
    };
    myChart5.setOption(option);
</script>
折线堆叠图
<script>
    var myChart6 = echarts.init(document.getElementById("main7"));
    option = {
        title:{
            text: '折线堆叠图',
            textStyle:{
                color: 'red',
                fontWeight:'lighter',
                fontStyle:'italic'
            },
            subtext:'副标题'
        },
        legend: {},
        tooltip: {
            trigger : 'axis',
            axisPointer:{
                type: 'cross'
            }
        },
        xAxis:{
            type:'category',
            data: [1,2,3,4,5,6,7],
            axisLabel:{
                interval:0,
                rotate:20
            }
        },
        yAxis:{
            type: 'value',
            scale: true
        },
        series:[
            {
             name:'数据1',
             type: 'line',
             data:[220, 182, 191, 234, 290, 330, 310]
            },
            {
             name:'数据2',
             type: 'line',
             data:[120, 132, 101, 134, 90, 230, 210]
            },
            {
             name:'数据3',
             type: 'line',
             data:[150, 232, 201, 154, 190, 330, 410]
            },
        ]
    };
    myChart6.setOption(option);
</script>
玫瑰图
<script>
    var myChart7 = echarts.init(document.getElementById("main8"));
    option = {
        title: {
            text: '玫瑰图',
            textStyle :{
                color : 'red',
                fontWeight: 'lighter',
                fontStyle: 'italic'
            },
            subtext: '副标题'
        },
        legend: {},
        tooltip: {
            trigger : 'item',
            formatter: '{a}<br />{b}:{c}({d}%)'
        },
        series:[
        {
            name: '数据',
            type: 'pie',
            roseType: 'area',
            radius: [40,100],
            data: [
            {value:23,name:'一号'},
            {value:20,name:'二号'},
            {value:31,name:'三号'},
            {value:26,name:'四号'}
            ]
        }
        ]
    };
    myChart7.setOption(option);
</script>
效果展示