别人的问题,经常被问到,记录一下。
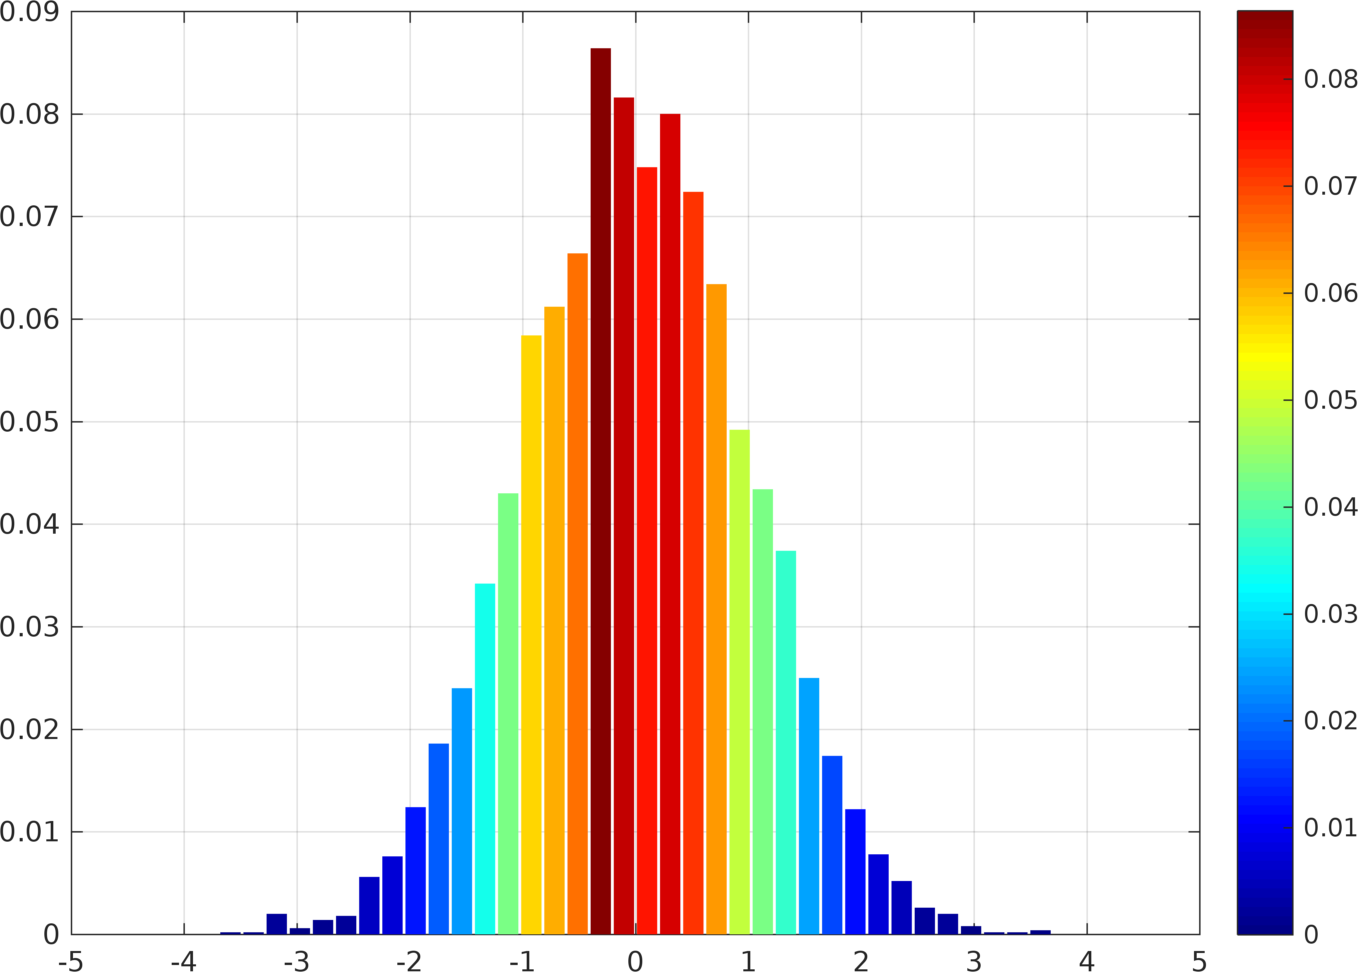
目的是根据bar的值,设置 bar的color.
思路,
不同的版本,实现方法不太一样。
2014a之后,是用bar一个一个的画。
2014a之前,是设置children的color.
clear all
clc
clf

%% outline
% http://www.ilovematlab.com/thread-545585-1-1.html
% mod : 17-May-2018 10:24:20


%% main
% generate bar data
a=randn(5000,1);
[hi_va,hi_bi]=hist(a,linspace(-4,4,40));
hi_va=hi_va./sum(hi_va);
n_bar = length(hi_bi);
hi_max = max(hi_va);

% generate color
n_col=100;
col_mm = colormap(jet(n_col));

% plot bar each time
hold on
for i =1:n_bar

    ind_col = floor((n_col-1)*hi_va(i)/hi_max)+1; % connect hi_va and colormap
    bar(hi_bi(i),hi_va(i),'edgecolor','none',...
        'facecolor',col_mm(ind_col,:),...
        'barwidth',0.18);

end

% other setting
colormap(col_mm)
caxis([0 hi_max])
colorbar
box on
grid on


%% 2014a and before
% a=randn(5000,1);
% [hi_va,hi_bi]=hist(a,linspace(-4,4,40));
% hi_va=hi_va./sum(hi_va);
% n_bar = length(hi_bi);
% hi_max = max(hi_va);
%
% % generate color
% n_col=100;
% col_mm = colormap(jet(n_col));
% h=bar(hi_bi,hi_va);
% ch = get(h,'Children');
% fvd = get(ch,'Faces');
% fvcd = get(ch,'FaceVertexCData');
% for row = 1:n_bar
%      fvcd(fvd(row,:)) = hi_va(row);
% end
%
% set(ch,'FaceVertexCData',fvcd)
% caxis([0 hi_max])
%
% colorbar
% grid on


%% logs
% mod : 17-May-2018 10:25:33