一、前言
上一张我们完成了UI自动化的执行功能,这一章我们将讲解如何定制化实现测试报告。
完整教程地址:《从0搭建自动化测试平台》
项目在线演示地址:http://121.43.43.59/ (帐号:admin 密码:123456)
本章内容实现效果如下:
二、使用antd-charts实现图表报告
测试报告需要使用图表将测试结果、数据可视化,之前大多都是用echarts来实现的,但自己框架使用的是antd ,而且他们的官方库antd-charts一样能实现一些可视化图表,所以我们完全可以使用antd-charts来实现实现我们的测试报告展示。
antd-charts官网:https://charts.ant.design/zh/examples/gallery
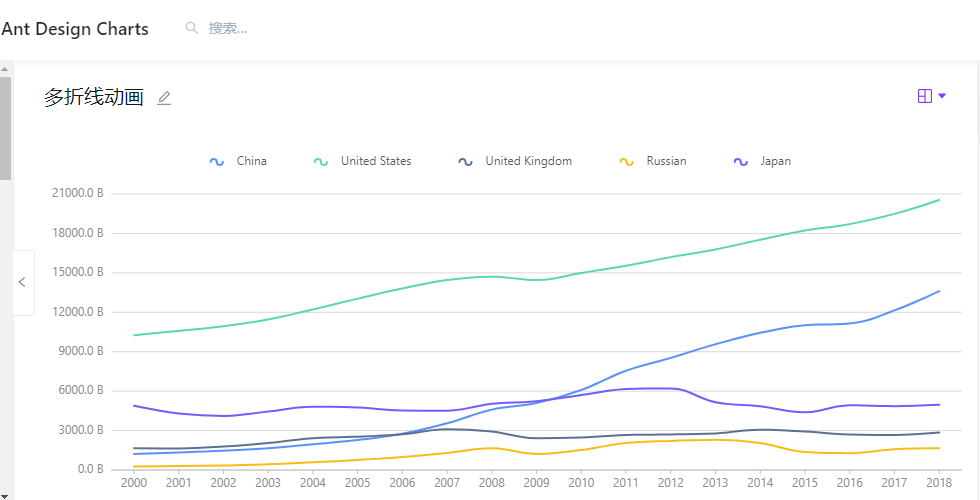
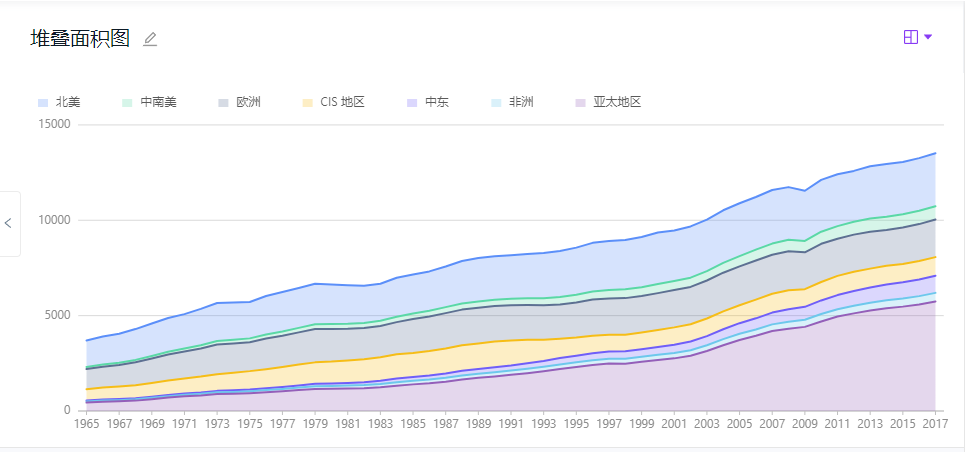
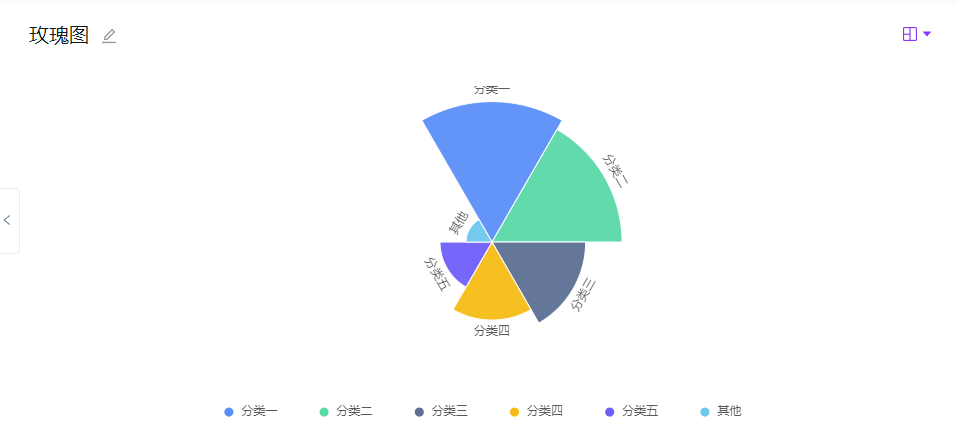
打开官网会发现它支持很多图表,包括一些常见的饼图,折线图,柱状图等.
不常见的漏斗图、玉珏图、分面图等也支持。而且也非常美观:
扫描二维码关注公众号,回复:
13770820 查看本文章

它也有非常详尽的文档帮助我们学习使用:
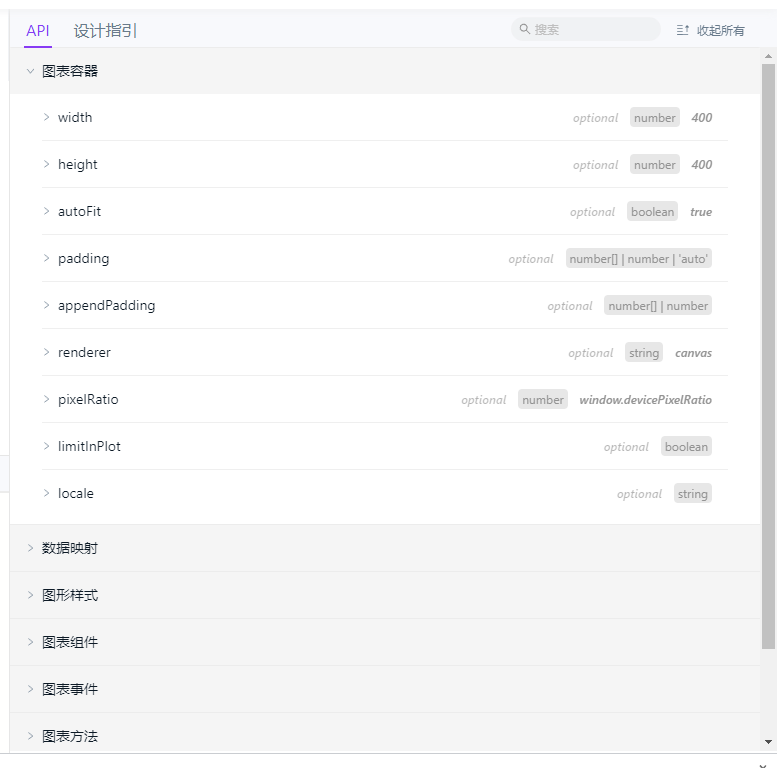
我们只需要根据自己的想法或实际业务需求选择对应的图表做数据渲染就OK了。也是非常的方便的!
三、测试报告源码分享
这里将实现效果的测试报告源码分享给大家参考,使用的组件:antd的栅格布局、antd-charts图表:
import {
useState, useEffect } from 'react';
import {
Row, Col, Card } from 'antd';
import {
Gauge, Column, Liquid, Area } from '@ant-design/plots';
import style from './index.css';
export default function App() {
const [data, setData] = useState([]);
useEffect(() => {
asyncFetch();
}, []);
const asyncFetch = () => {
fetch('https://gw.alipayobjects.com/os/bmw-prod/360c3eae-0c73-46f0-a982-4746a6095010.json')
.then((response) => response.json())
.then((json) => setData(json))
.catch((error) => {
console.log('fetch data failed', error);
});
};
const config = {
data,
xField: 'timePeriod',
yField: 'value',
xAxis: {
range: [0, 1],
},
};
const colData: any = [
{
"year": "登录",
"value": 1,
"type": "失败"
},
{
"year": "登录",
"value": 3,
"type": "通过"
},
{
"year": "创建用户",
"value": 20,
"type": "通过"
},
{
"year": "创建用户",
"value": 3,
"type": "失败"
}, {
"year": "创建订单",
"value": 12,
"type": "通过"
},
{
"year": "创建订单",
"value": 1,
"type": "失败"
}, {
"year": "注册用户",
"value": 16,
"type": "通过"
},
{
"year": "注册用户",
"value": 6,
"type": "失败"
}, {
"year": "修改用户信息",
"value": 18,
"type": "通过"
},
{
"year": "修改用户信息",
"value": 9,
"type": "失败"
}]
const liqConfig = {
percent: 0.80,
color: '#30BF78',
outline: {
border: 4,
distance: 8,
},
wave: {
length: 128,
},
}
const colConfig: any = {
data: colData,
isStack: true,
color: ['#F4664A', '#30BF78'],
xField: 'year',
yField: 'value',
seriesField: 'type',
label: {
// 可手动配置 label 数据标签位置
position: 'middle',
// 'top', 'bottom', 'middle'
// 可配置附加的布局方法
layout: [
// 柱形图数据标签位置自动调整
{
type: 'interval-adjust-position',
}, // 数据标签防遮挡
{
type: 'interval-hide-overlap',
}, // 数据标签文颜色自动调整
],
},
};
const gaudeConfig = {
percent: 0.75,
range: {
ticks: [0, 1 / 3, 2 / 3, 1],
color: ['#F4664A', '#FAAD14', '#30BF78'],
},
indicator: {
pointer: {
style: {
stroke: '#D0D0D0',
},
},
pin: {
style: {
stroke: '#D0D0D0',
},
},
},
statistic: {
content: {
style: {
fontSize: '36px',
lineHeight: '36px',
},
},
},
};
return (
<div style={
{
marginLeft: 120, marginTop: 20, marginRight: 120 }}>
<h1 style={
{
textAlign: 'center', fontWeight: 'bold' }}>
用户中心-UI测试报告
</h1>
<p>执行时间:2022年4月5日 15:09:18</p>
<Row
style={
{
backgroundColor: '#F1F1F1', paddingTop: 15, width: '100%' }}
gutter={
[20, 20]}
>
<Col className="wrapper" key={
1} span={
6}>
<Card style={
{
backgroundColor: '#6395f9' }}>
<h2
style={
{
fontWeight: 600, color: 'white', textAlign: 'center' }}
>执行环境:测试</h2>
</Card>
</Col>
<Col className="wrapper" key={
2} span={
6}>
<Card style={
{
backgroundColor: '#62daab' }}>
<h2
style={
{
fontWeight: 600, color: 'white', textAlign: 'center' }}
>{
`涉及用例数:10 个`}</h2>
</Card>
</Col>
<Col className="wrapper" key={
3} span={
6}>
<Card style={
{
backgroundColor: '#657798' }}>
<h2
style={
{
fontWeight: 600, color: 'white', textAlign: 'center' }}
>{
`总步骤数:120 个`}</h2>
</Card>
</Col>
<Col className="wrapper" key={
4} span={
6}>
<Card style={
{
backgroundColor: '#f6c002' }}>
<h2
style={
{
fontWeight: 600, color: 'white', textAlign: 'center' }}
>{
`总耗时:128.6 S`}</h2>
</Card>
</Col>
<Col className="wrapper" key={
7} span={
8}>
<Card title={
<h3 className={
style.cardTitle}>用例覆盖率</h3>}>
<Liquid {
...liqConfig} />
</Card>
</Col>
<Col className="wrapper" key={
5} span={
8}>
<Card title={
<h3 className={
style.cardTitle}>用例成功率</h3>}>
<Gauge {
...gaudeConfig} />
</Card>
</Col>
<Col className="wrapper" key={
6} span={
8}>
<Card
title={
<h3 className={
style.cardTitle}>各用例情况统计</h3>}
>
<Column {
...colConfig} />
</Card>
</Col>
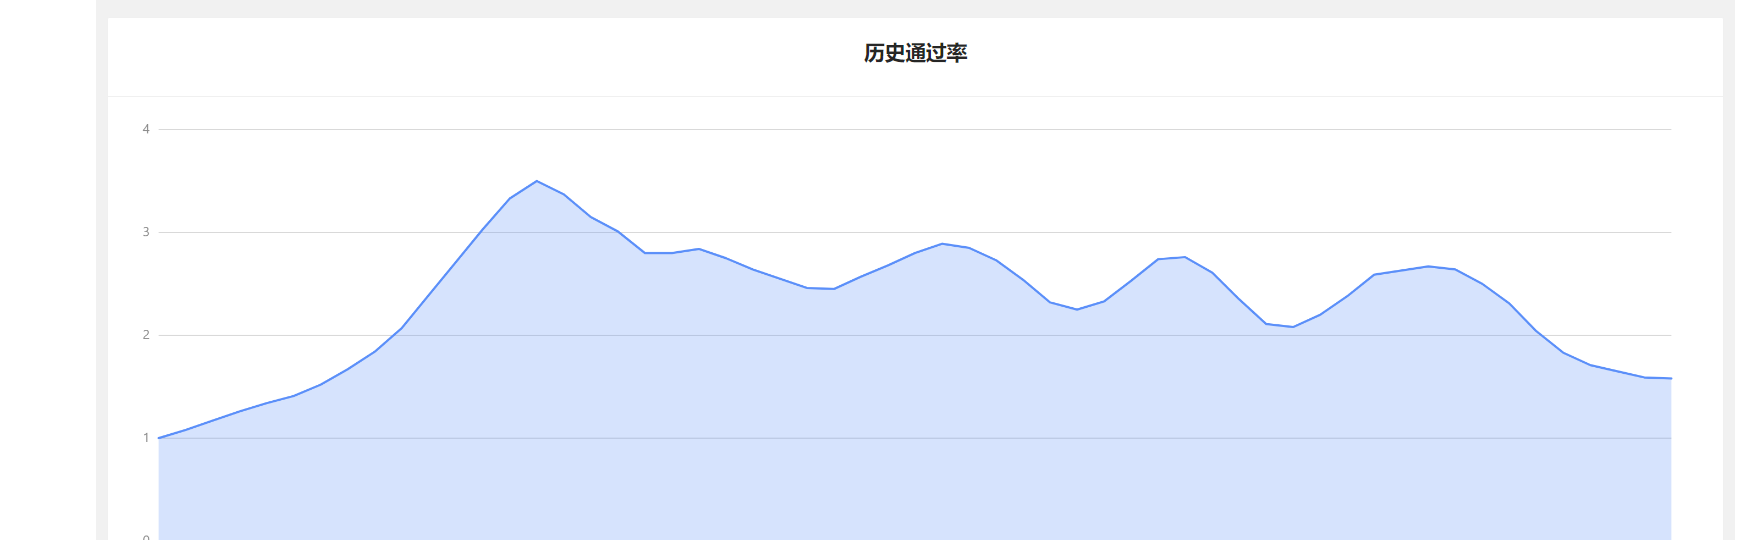
<Col className="wrapper" key={
8} span={
24}>
<Card
title={
<h3 className={
style.cardTitle}>历史通过率</h3>} >
<Area {
...config} />
</Card>
</Col>
</Row>
</div>
);
}
四、总结
测试报告是指把测试的过程和结果写成文档,对发现的问题和缺陷进行分析,为纠正软件的存在的质量问题提供依据,同时为软件验收和交付打下基础。这是尤为重要的。很多时候大家是通过allure、httprunner等模板来生成测试报告,但对于定制化强的项目、有高度定制化需求时,还是需要我们自定义测试报告,小伙伴们可以根据自己的想法去组合使用各种图表来实现更详尽美观的报告。