分别使用Excel,jupyter,jupyter+sklearn做线性回归练习
一、用Excel中数据分析功能做线性回归
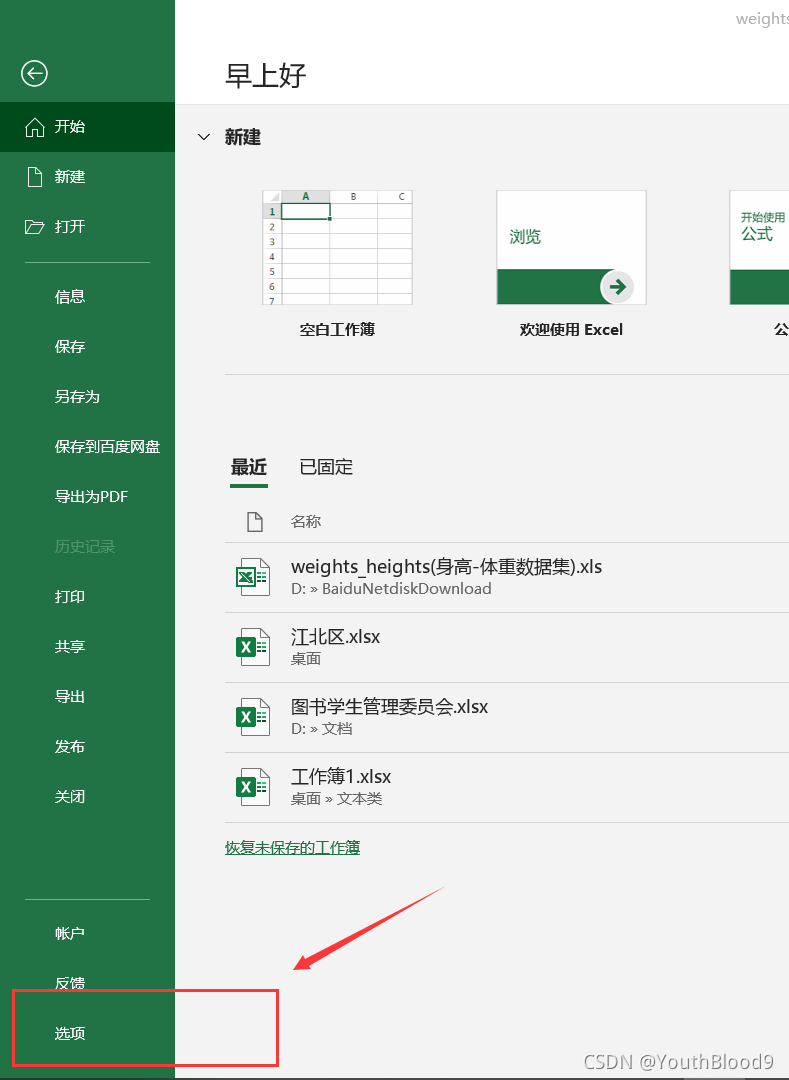
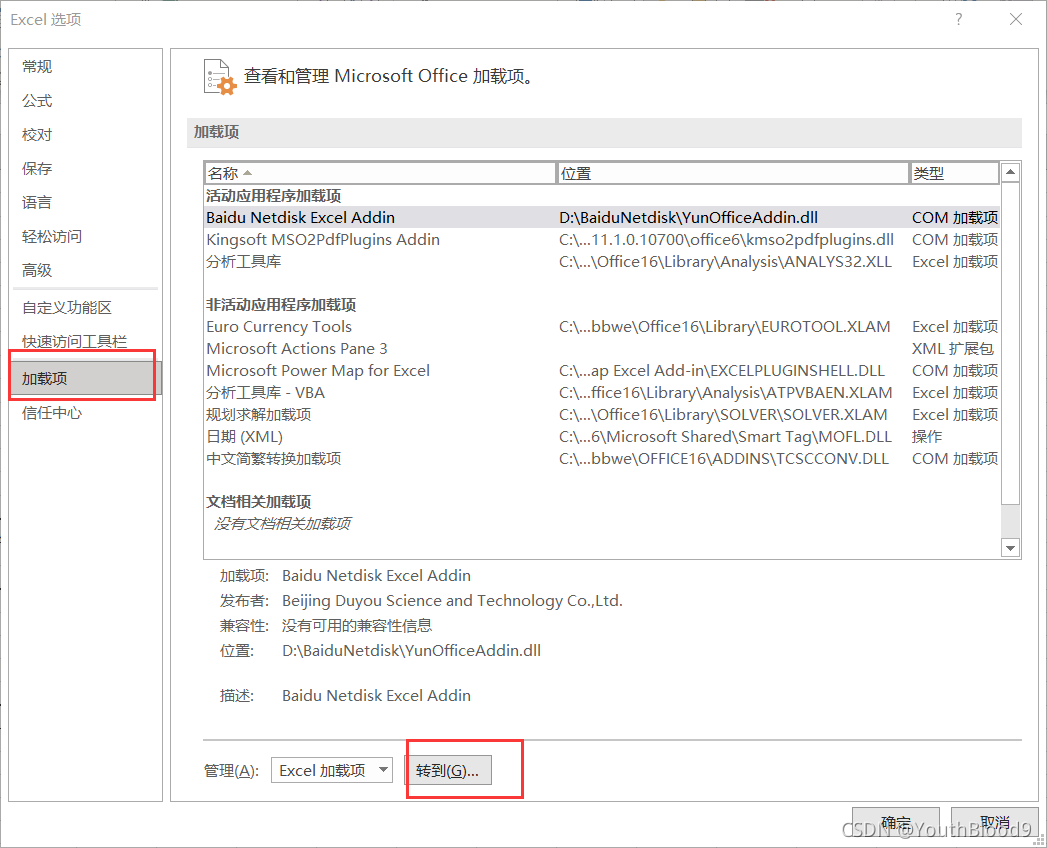
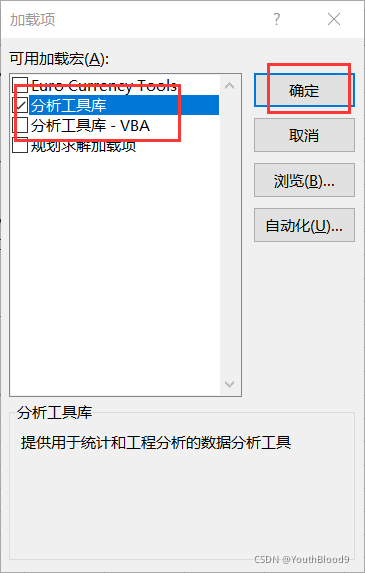
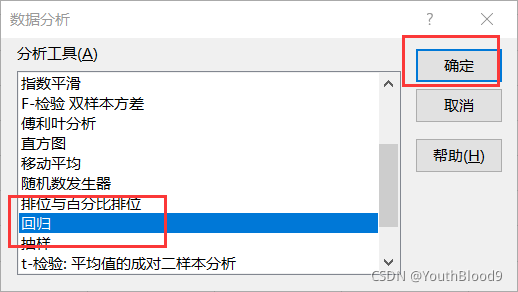
1.准备工作:配置Excel
(1)打开文件后,点击文件——选项——加载项——转到——勾选——确定

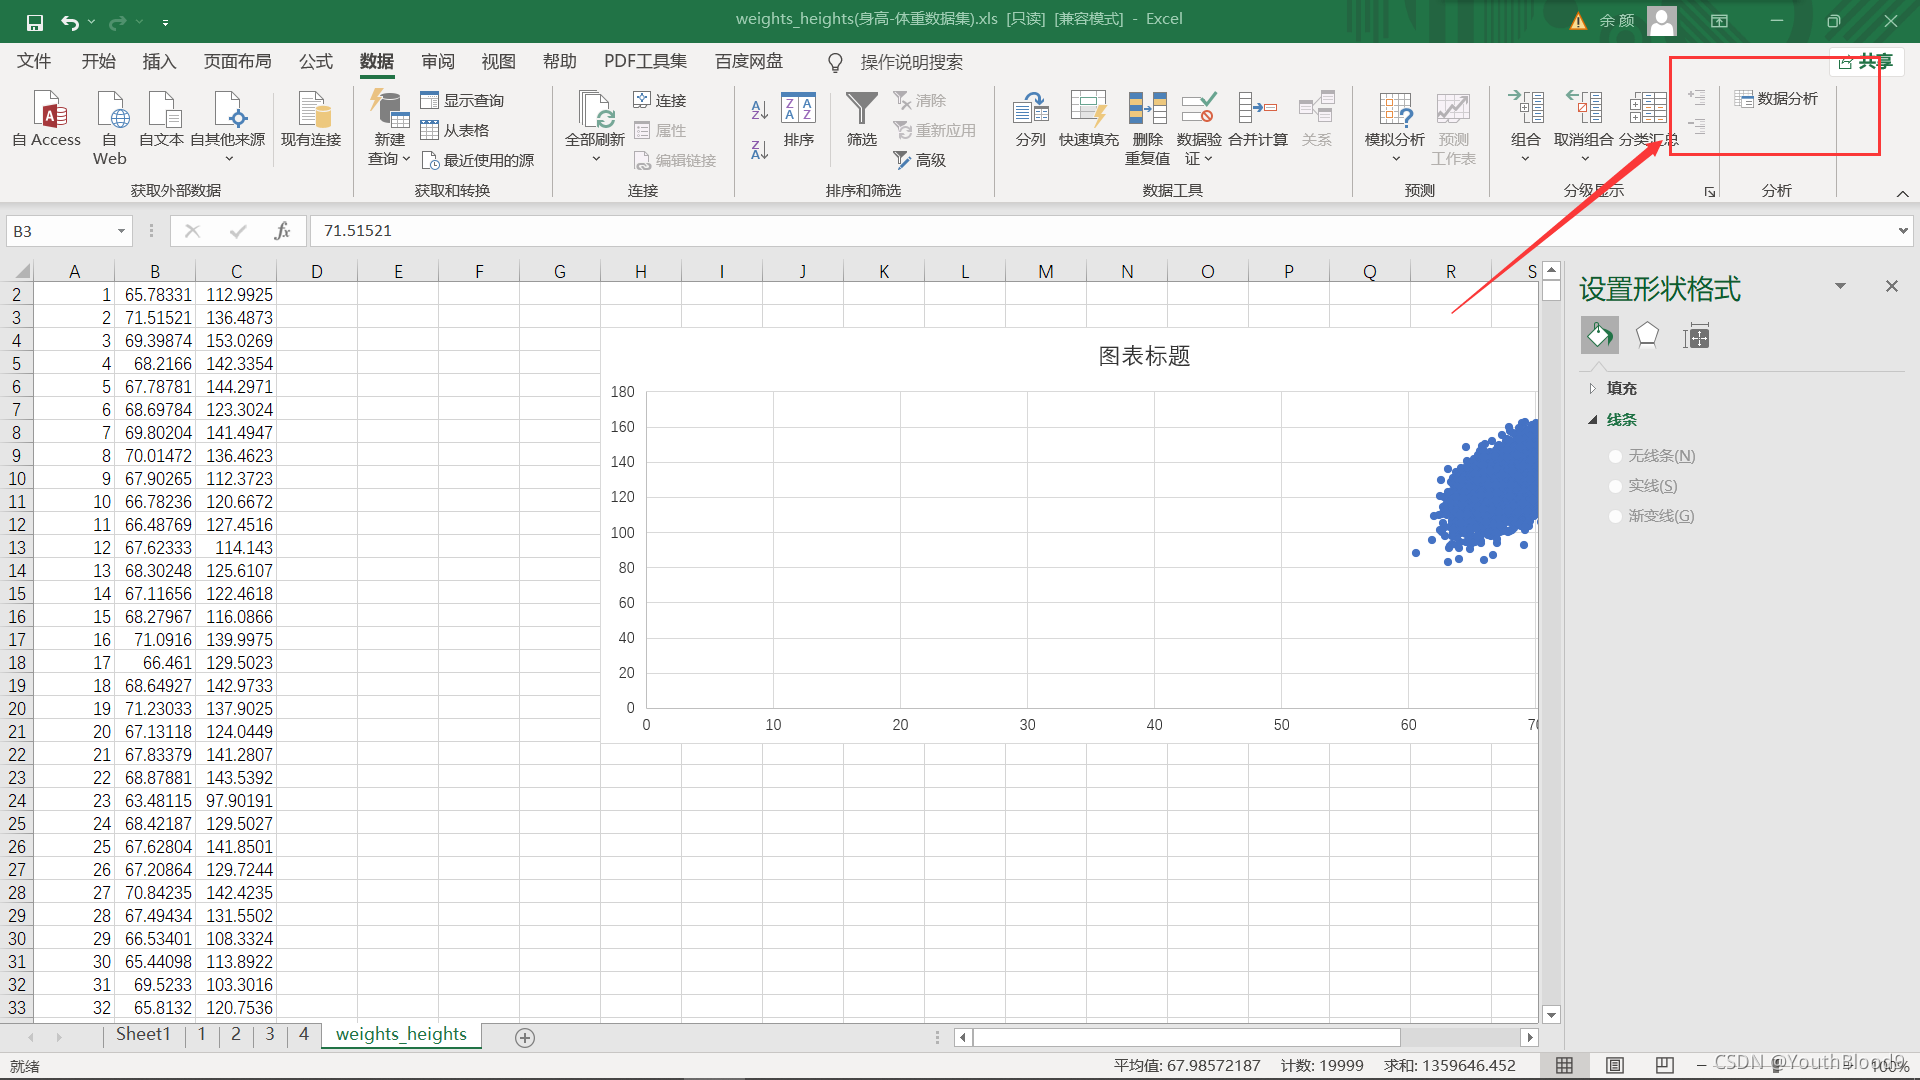
(2)步骤
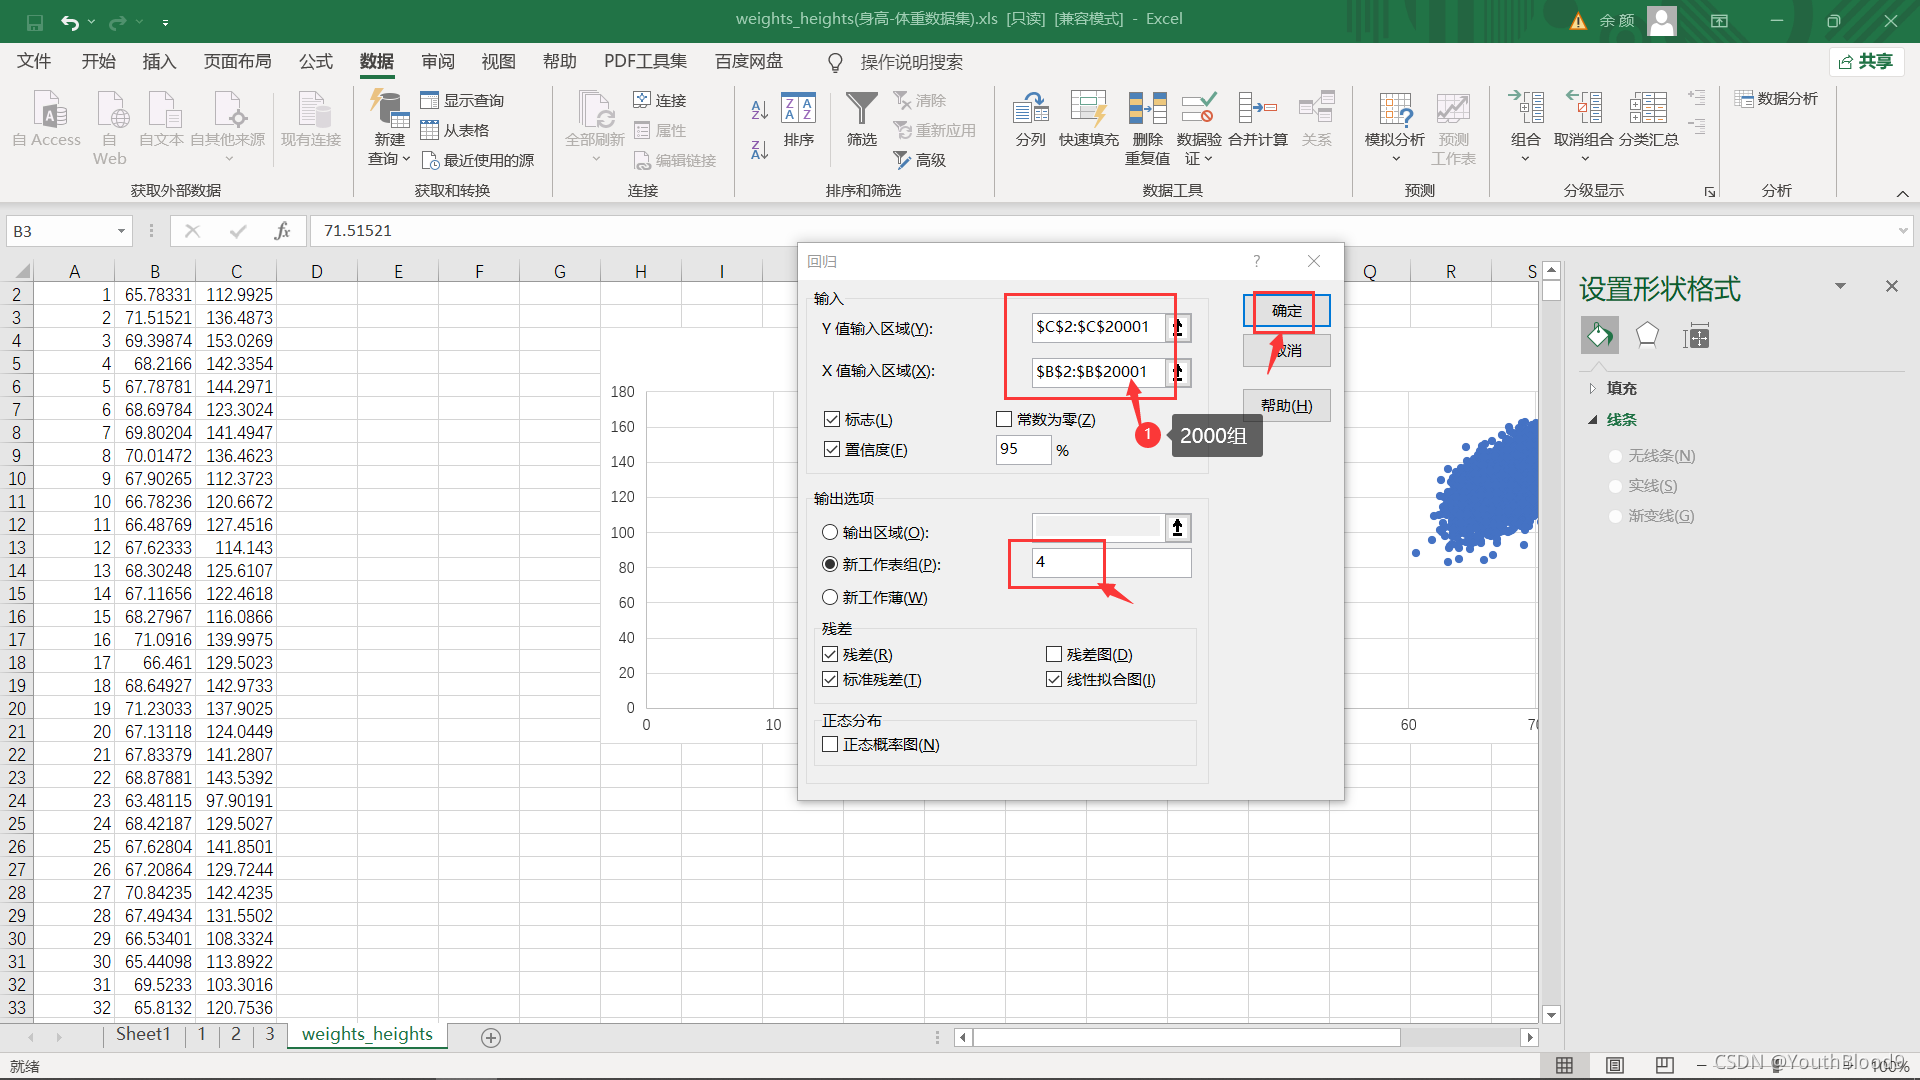
点击 数据分析——回归——确定
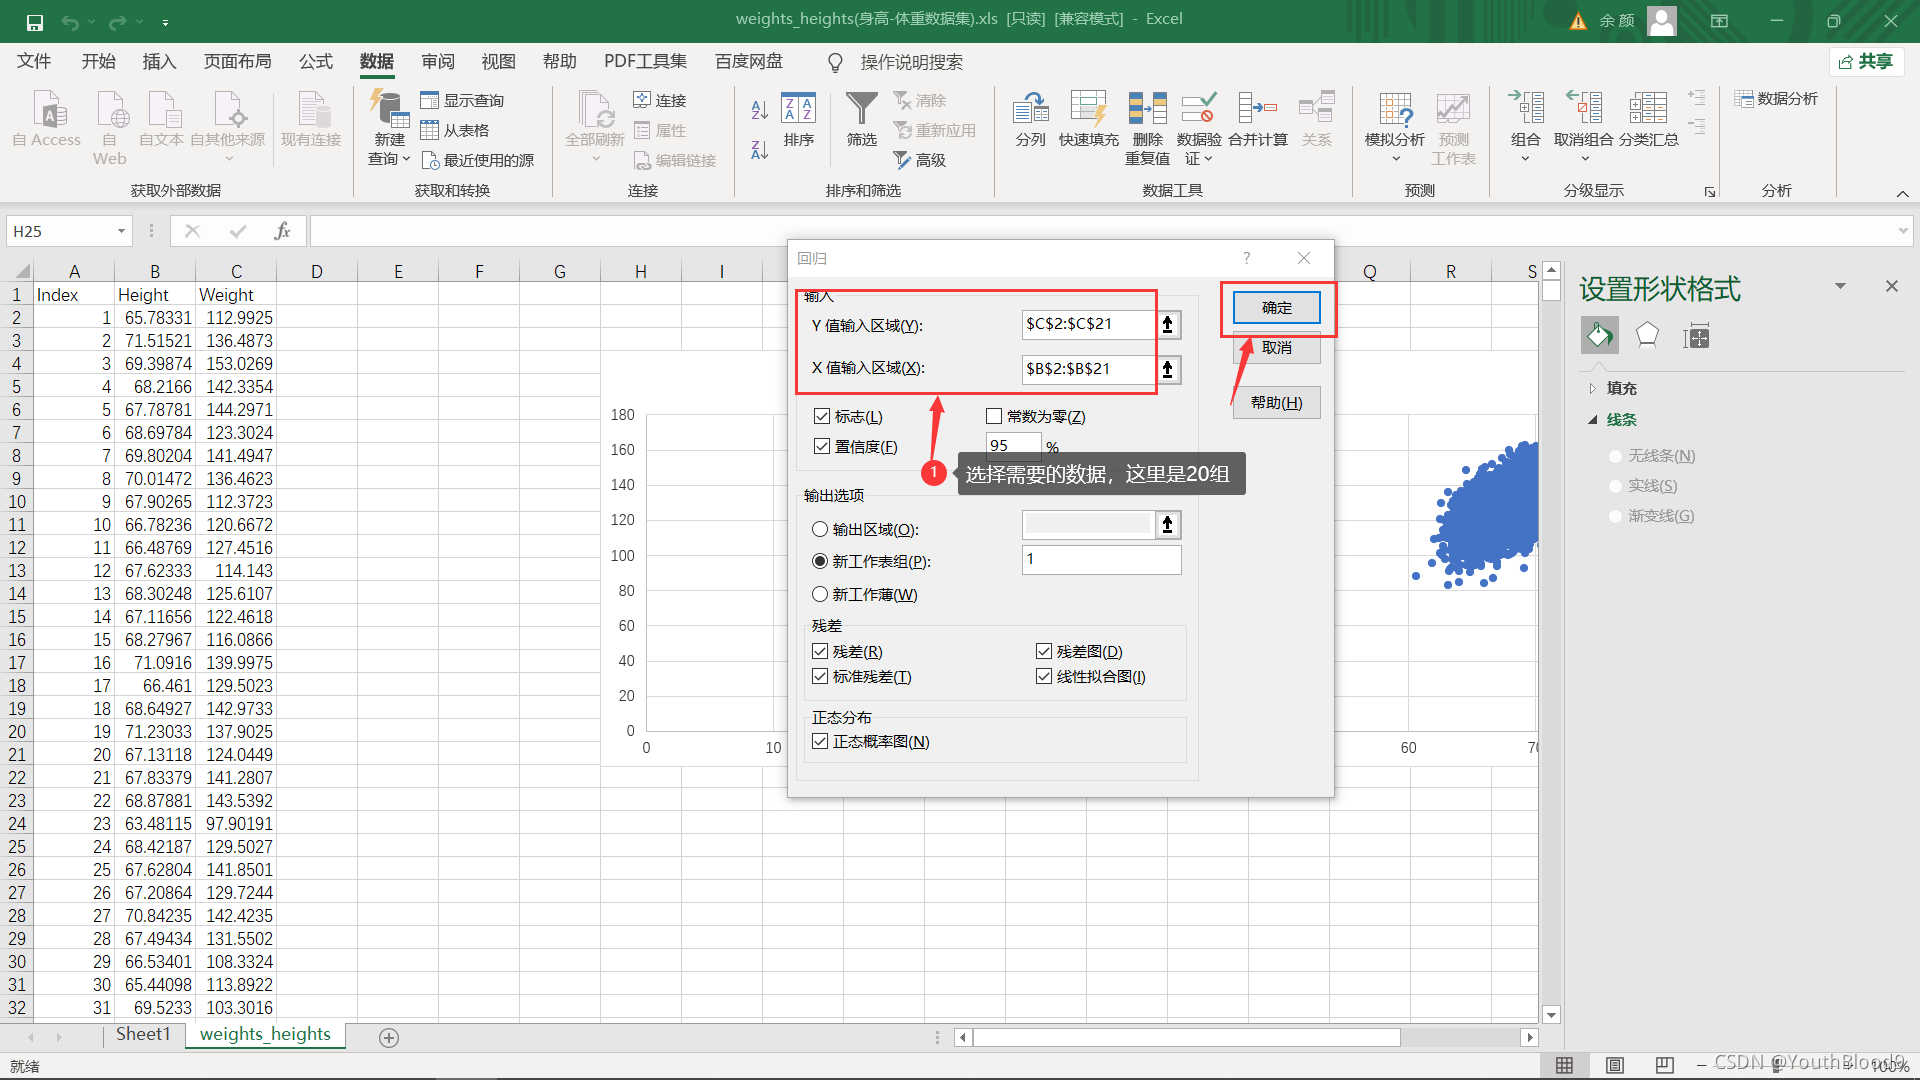
2.分别取20、200、2000、20000组数据来做线性回归
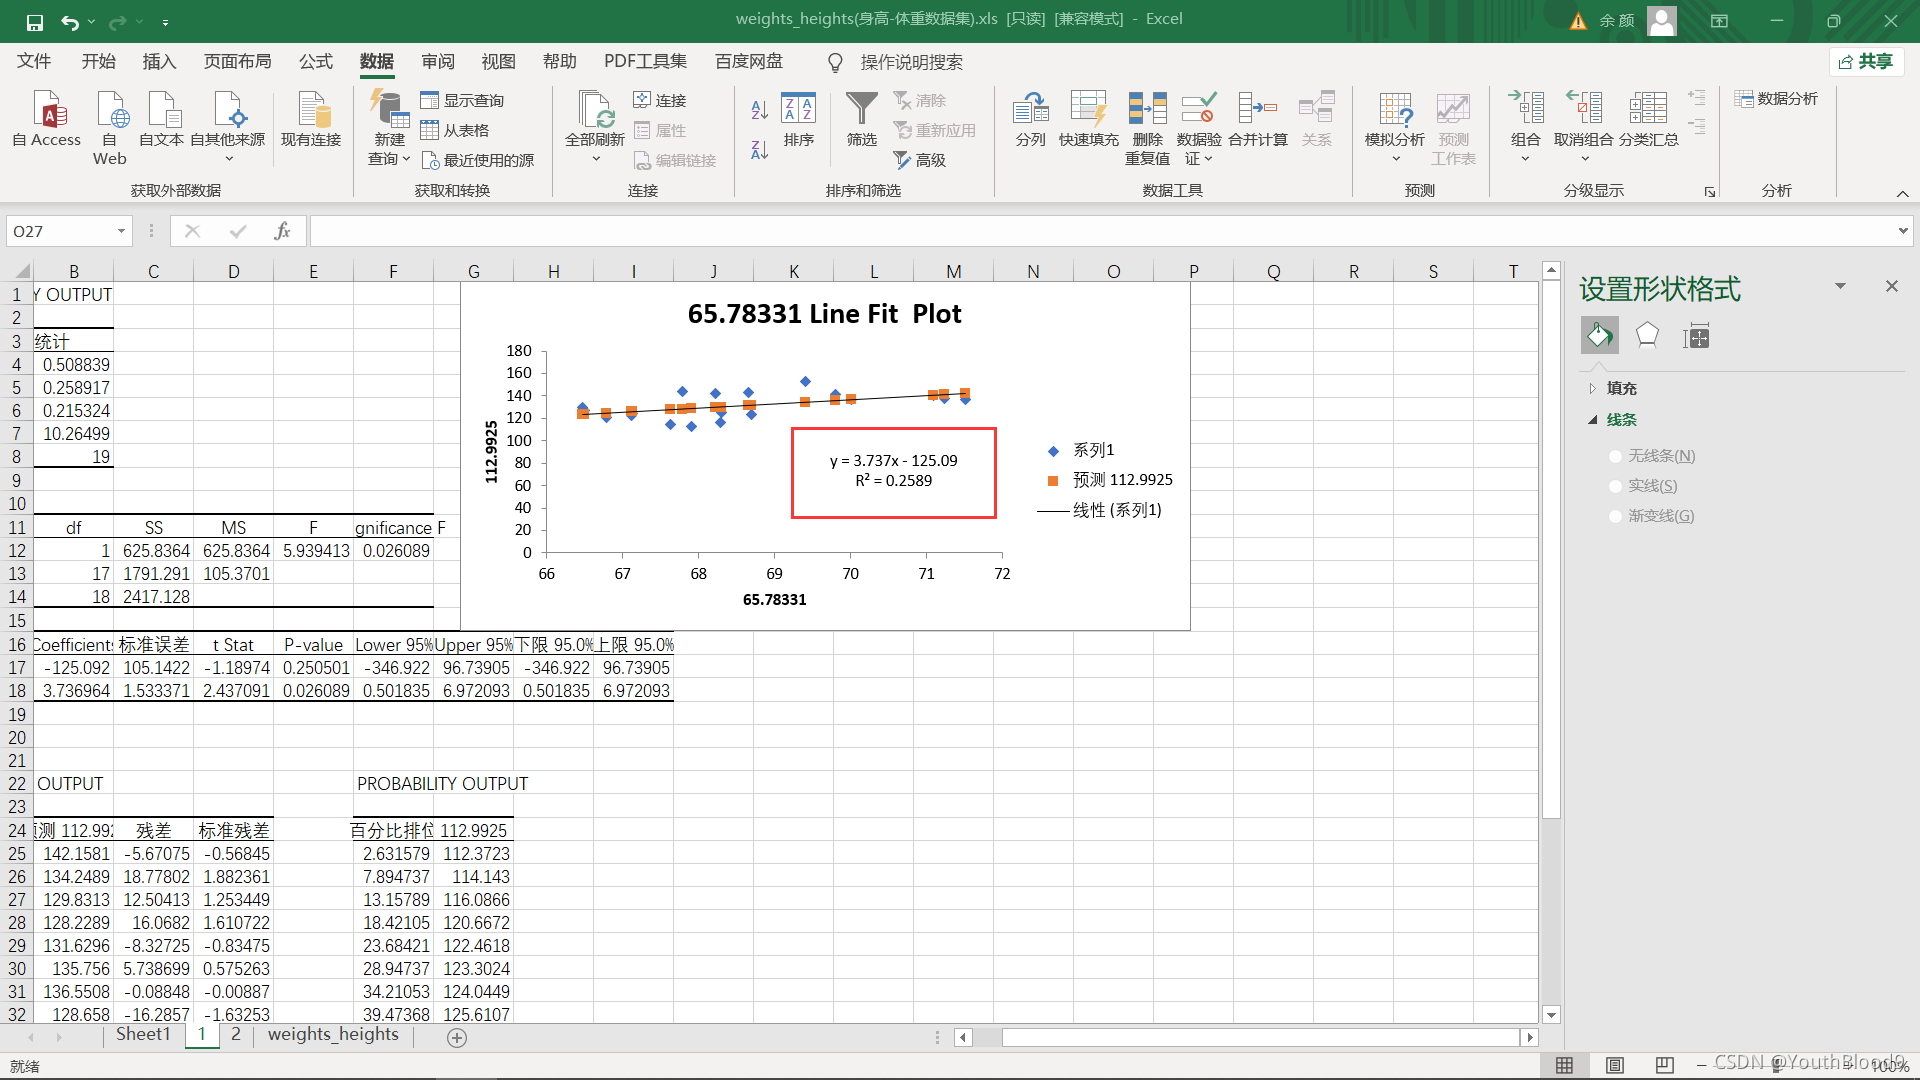
(1)20组数据:
(2)200组数据:

扫描二维码关注公众号,回复:
13395815 查看本文章


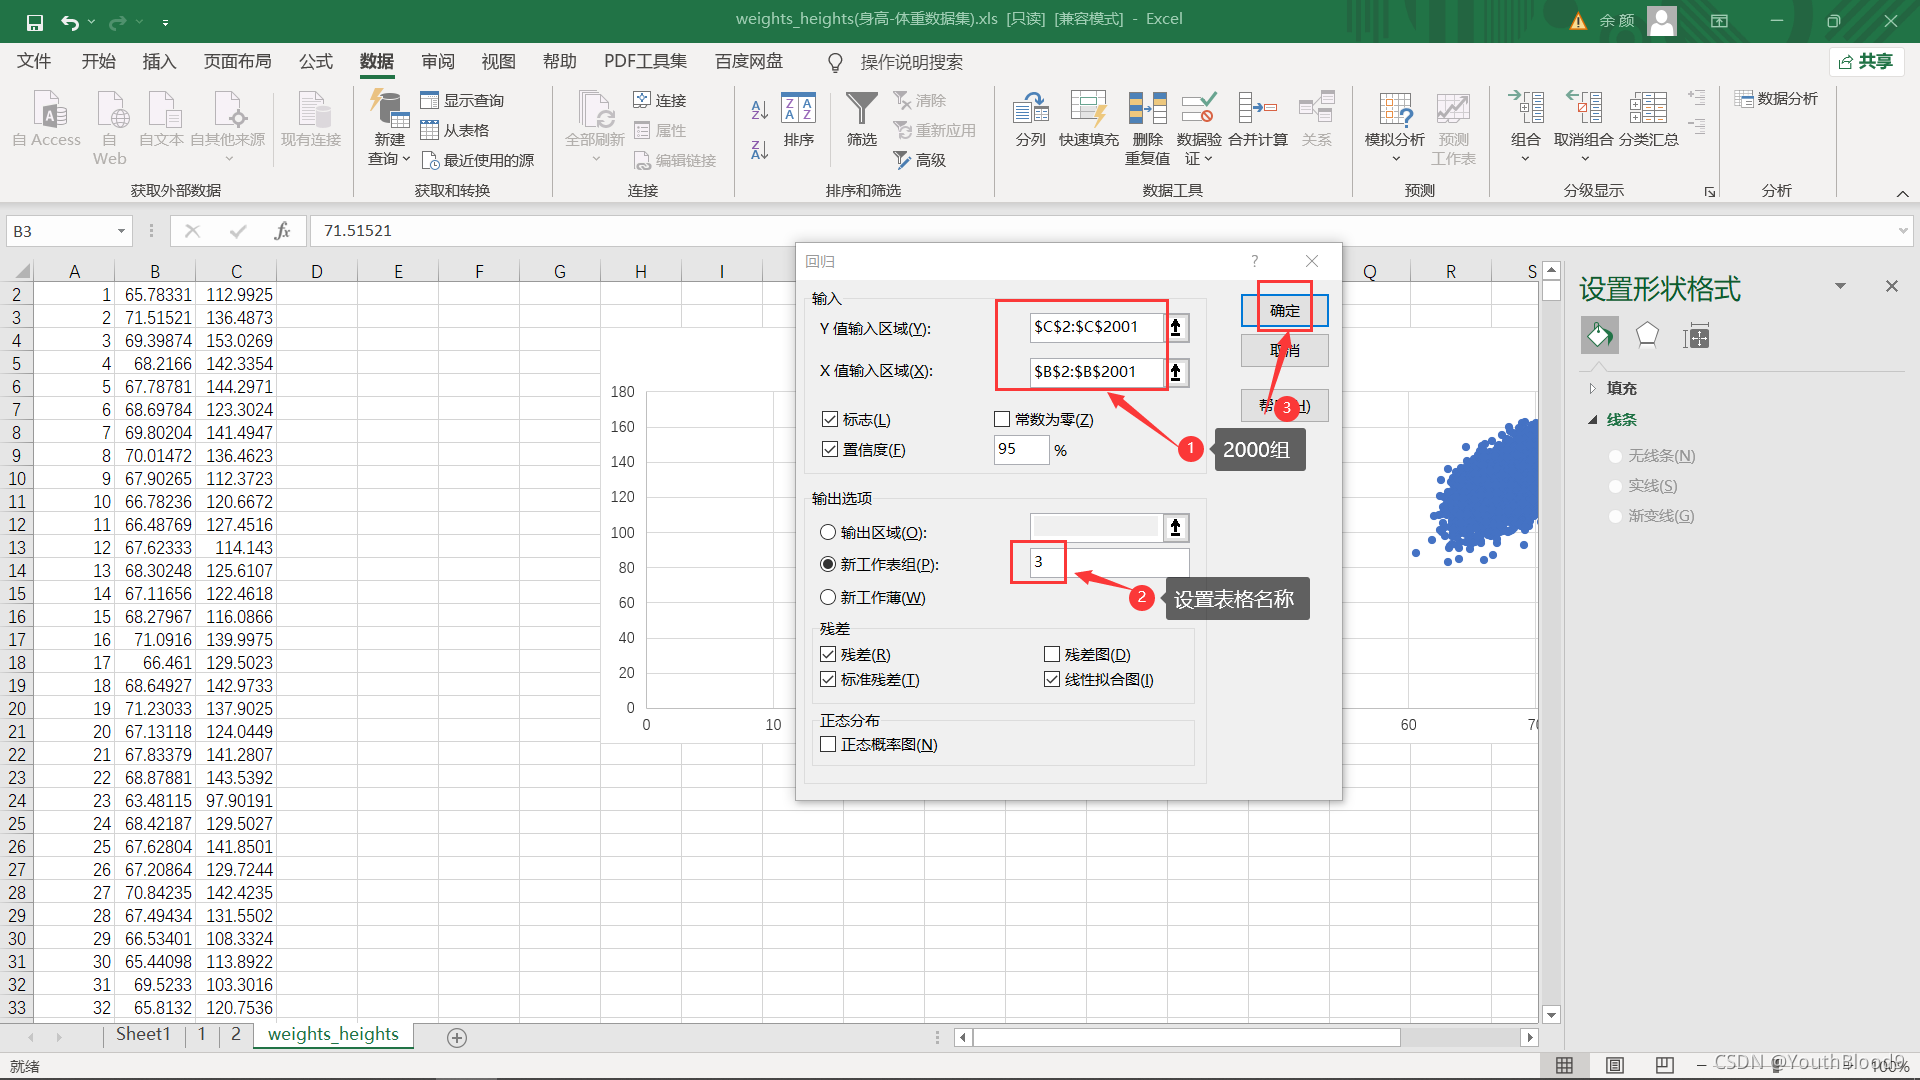
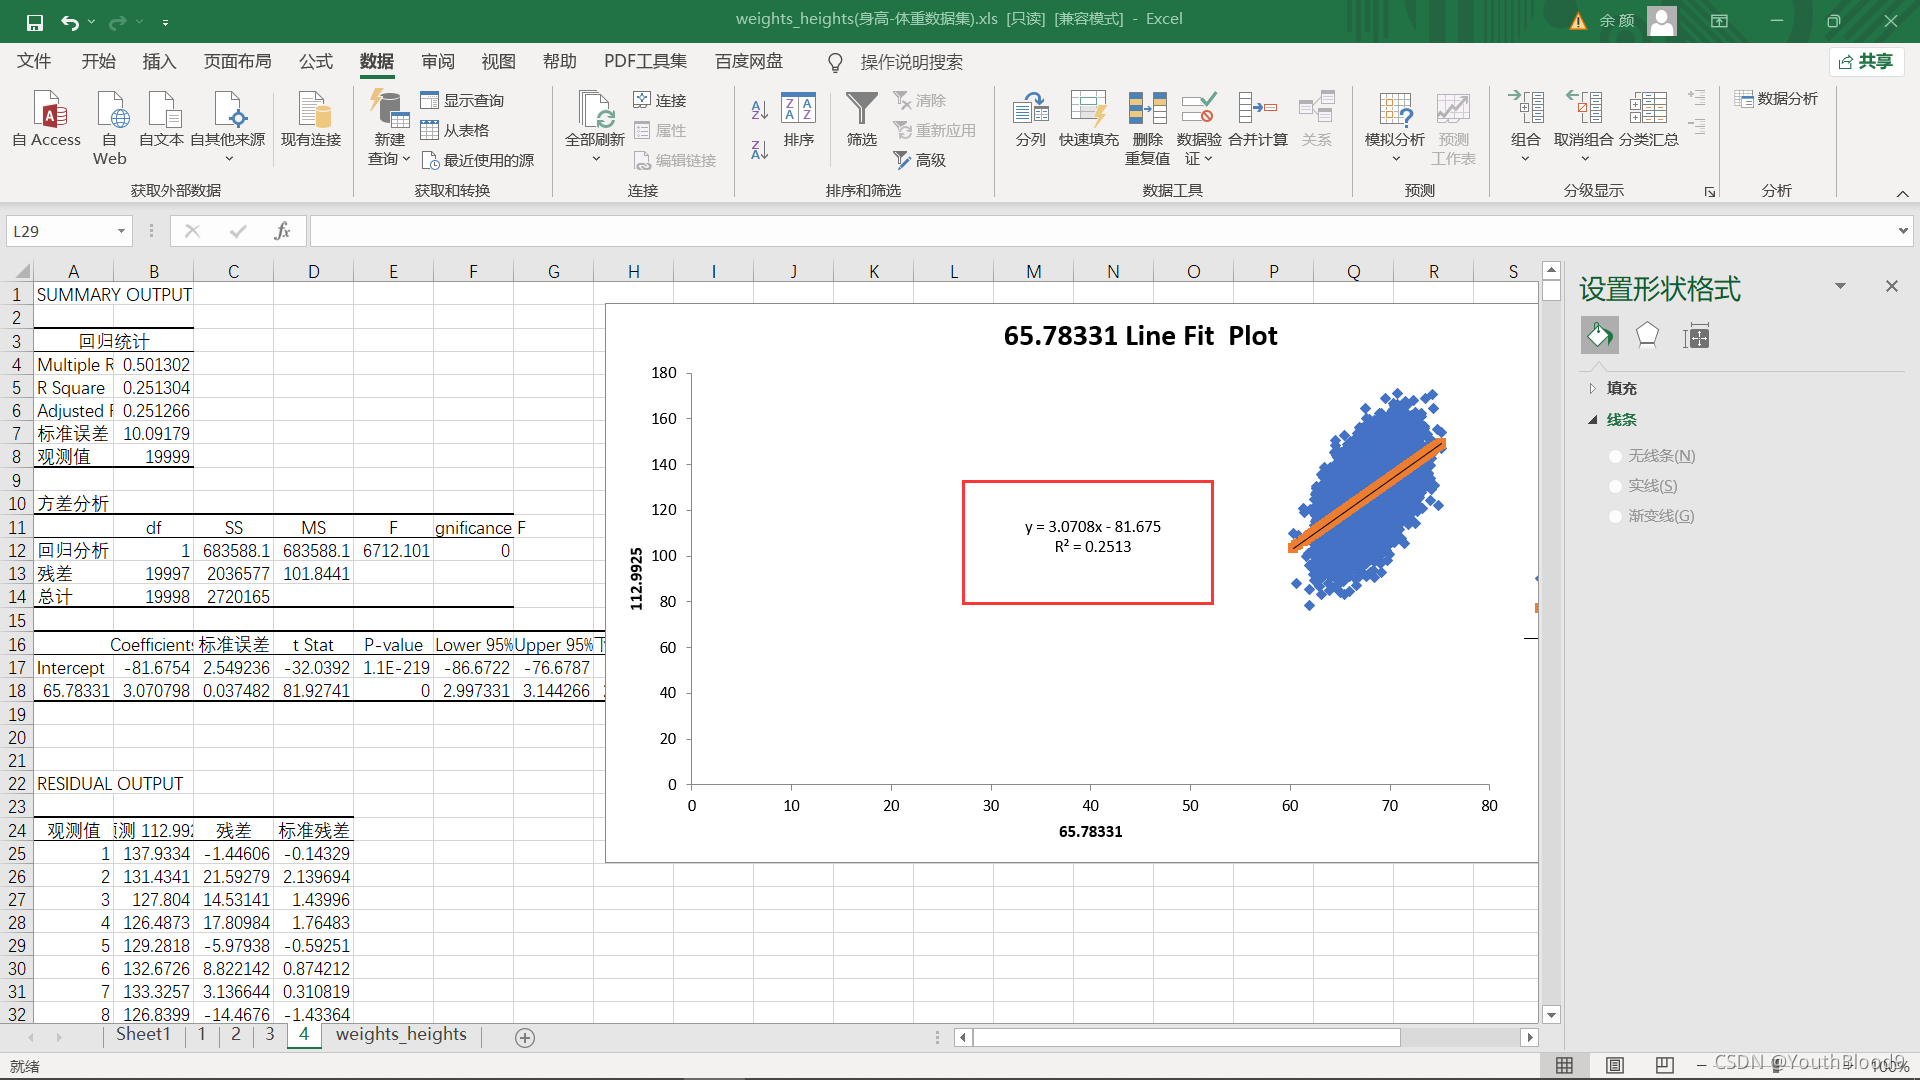
(3)2000组数据:

(4)20000组数据:
二、用jupyter编程(不借助第三方库)来做线性回归
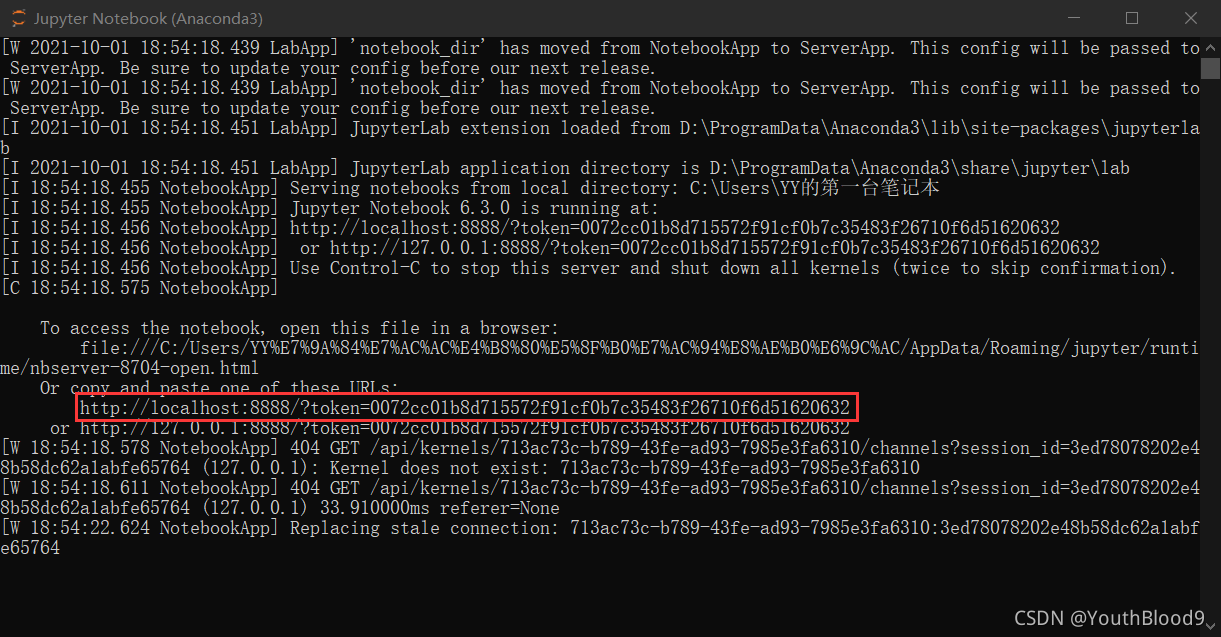
1.打开jupyter步骤

选择红框中链接在网页中打开:
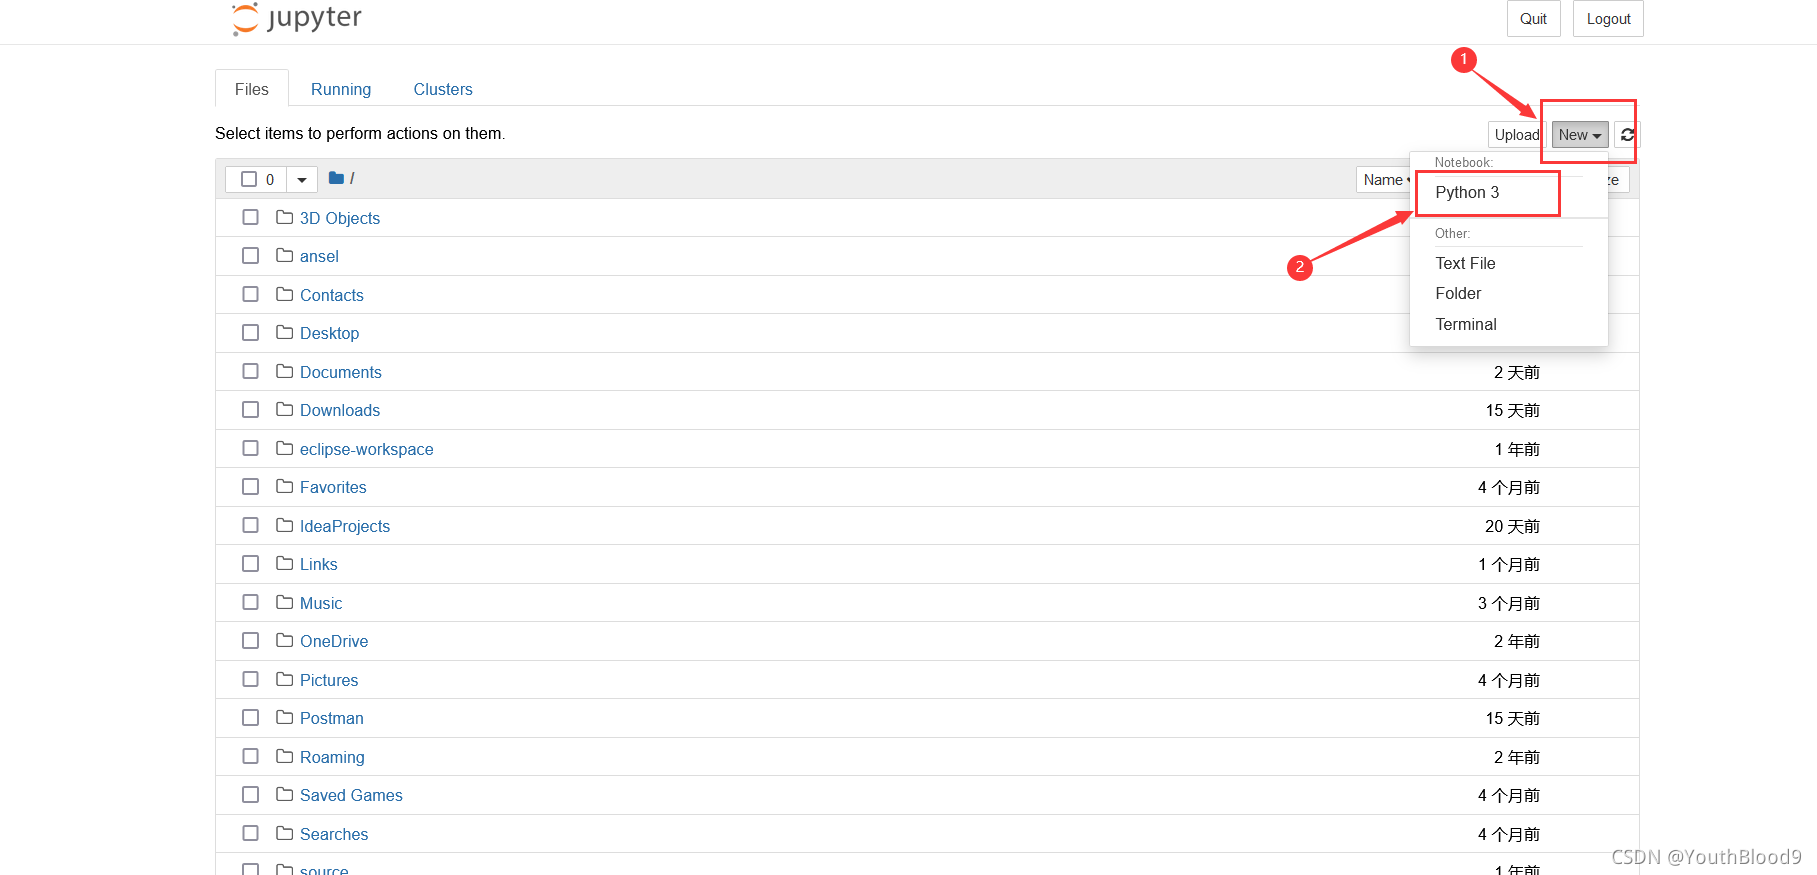
新建:
2.代码
#不掉包实现一元线性回归
import pandas as pd
import matplotlib.pyplot as plt
def read_file(raw):#根据行数来读取文件
    df = pd.read_excel('D:\BaiduNetdiskDownload\weights_heights(身高-体重数据集).xls',sheet_name ='weights_heights')
    height=df.iloc[0:raw,1:2].values
    weight=df.iloc[0:raw,2:3].values
    return height,weight

def array_to_list(array):#将数组转化为列表
    array=array.tolist()
    for i in range(0,len(array)):
        array[i]=array[i][0]
    return array

def unary_linear_regression(x,y):#一元线性回归,x,y都是列表类型
    xi_multiply_yi=0
    xi_square=0;
    x_average=0;
    y_average=0;
    f=x
    for i in range(0,len(x)):
        xi_multiply_yi+=x[i]*y[i]
        x_average+=x[i]
        y_average+=y[i]
        xi_square+=x[i]*x[i]
    x_average=x_average/len(x)
    y_average=y_average/len(x)
    b=(xi_multiply_yi-len(x)*x_average*y_average)/(xi_square-len(x)*x_average*x_average)
    a=y_average-b*x_average
    for i in range(0,len(x)):
        f[i]=b*x[i]+a
    R_square=get_coefficient_of_determination(f,y,y_average)
    print('R_square='+str(R_square)+'\n'+'a='+str(a)+'  b='+str(b))
    print(f'线性回归方程为:y={

      b}x {

      a}\n')

def get_coefficient_of_determination(f,y,y_average):#传输计算出的值f和x,y的真实值还有平均值y_average,获取决定系数,也就是R²
    res=0
    tot=0
    for i in range(0,len(y)):
        res+=(y[i]-f[i])*(y[i]-f[i])
        tot+=(y[i]-y_average)*(y[i]-y_average)
    R_square=1-res/tot
    return R_square

raw=[20,200,2000,20000]
for i in raw:
    print('数据组数为'+str(i)+":")
    height,weight=read_file(i)
    height=array_to_list(height)
    weight=array_to_list(weight)
    unary_linear_regression(height,weight)
结果:
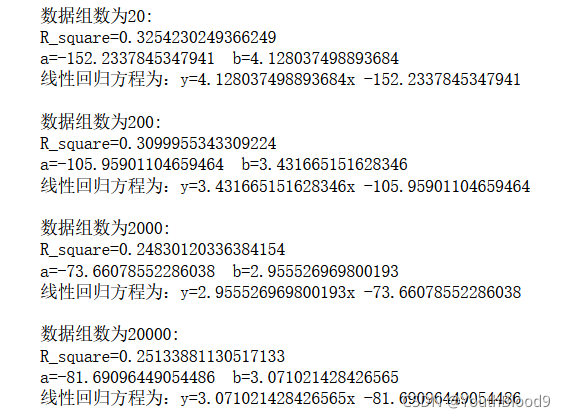
三、用jupyter编程(借助第三方库sklearn)来做线性回归
代码:
#调包实现一元线性回归
from sklearn import linear_model
from sklearn.metrics import r2_score
import numpy as np
import pandas as pd
def read_file(raw):#根据行数来读取文件
    df = pd.read_excel('D:\BaiduNetdiskDownload\weights_heights(身高-体重数据集).xls',sheet_name ='weights_heights')
    height=df.iloc[0:raw,1:2].values
    weight=df.iloc[0:raw,2:3].values
    return height,weight

raw=[20,200,2000,20000]#要读取的行数
for i in raw:
    print('数据组数为'+str(i)+":")
    height,weight=read_file(i)
    weight_predict=weight
    lm = linear_model.LinearRegression()
    lm.fit(height,weight)
    b=lm.coef_
    a=lm.intercept_
    weight_predict=lm.predict(height)#计算有方程推测出来的值
    R_square=r2_score(weight,weight_predict)#计算方差
    print('b='+str(b[0][0])+' a='+str(a[0]))
    print('R_square='+str(R_square))
    print('线性回归方程为:y='+str(b[0][0])+'x '+str(a[0])+'\n')
结果:
小小的总结
Excel的数据分析是一个很方便的工具,使用起来也很方便快捷;相对来说,用jupyter编程,对于我就比较难上手了,但对于线性回归还是有些茫然,代码是参考大佬的,属实写不太出来,但还是去运行了一遍,算是验证性学习了。