import math
import matplotlib.pyplot as plt
from PIL import Image
if __name__ =='__main__':
img = Image.open('./example.png').resize((128,128))
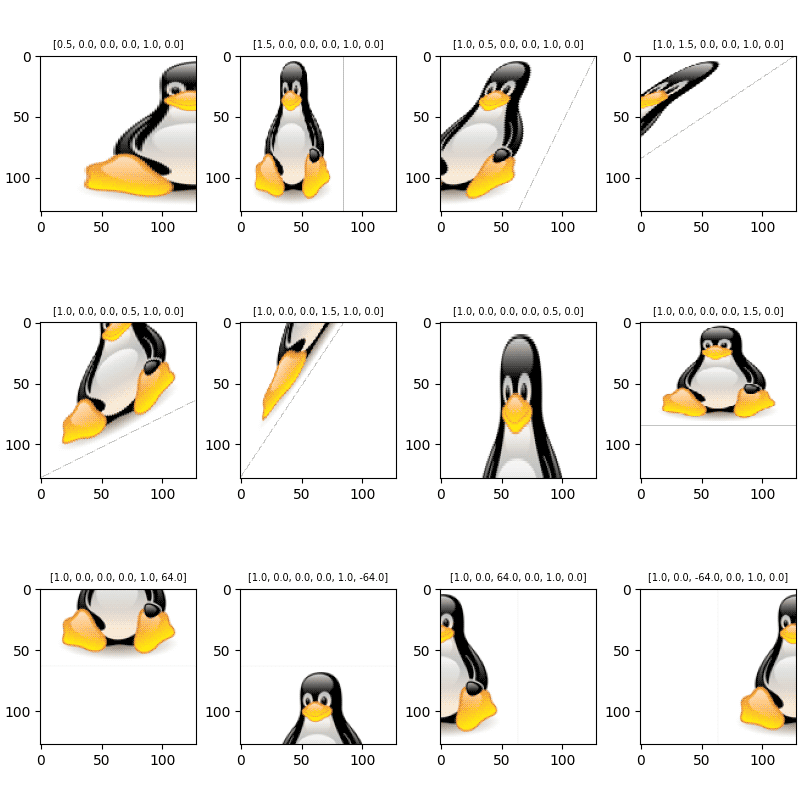
params =[# 参数[0.5,0.0,0.0,0.0,1.0,0.0],[1.5,0.0,0.0,0.0,1.0,0.0],[1.0,0.5,0.0,0.0,1.0,0.0],[1.0,1.5,0.0,0.0,1.0,0.0],[1.0,0.0,0.0,0.5,1.0,0.0],[1.0,0.0,0.0,1.5,1.0,0.0],[1.0,0.0,0.0,0.0,0.5,0.0],[1.0,0.0,0.0,0.0,1.5,0.0],[1.0,0.0,0.0,0.0,1.0,64],[1.0,0.0,0.0,0.0,1.0,-64],[1.0,0.0,64,0.0,1.0,0.0],[1.0,0.0,-64,0.0,1.0,0.0],]
plt.rcParams['figure.figsize']=(8.0,8.0)
plt.subplots(3,
math.ceil(len(params)/3),
constrained_layout=True)for i inrange(len(params)):
plt.subplot(3,
math.ceil(len(params)/3),
i+1)
plt.imshow(img.transform((128,128), Image.AFFINE, params[i]))
plt.title('['+(', '.join(['%.1f'% e for e in params[i]]))+']',
fontsize=7)
plt.show()