股票2.0版
上一篇的升级版。将数据可视化。
主运行文件
【gupiao_graph.py】
import sys
from PyQt5.QtWidgets import QApplication, QMainWindow,QTableWidgetItem
import gupiao
import requests
import time
from bs4 import BeautifulSoup
import pyqtgraph as pg
headers = {
"User-Agent": "Mozilla/5.0 (Windows NT 10.0; Win64; x64) AppleWebKit/537.36 (KHTML, like Gecko) Chrome/88.0.4324.190 Safari/537.36 FS"}
#存放所有数据的列表
listx = []
arr = []
arrx = []
arry = []
def get_message(text, page):
soup = BeautifulSoup(text, 'lxml')
if soup.tbody.string !=None:
return 0
else:
for each in soup.tbody.find_all('tr'):
th = each.select('th')
td = each.select('td')
listline = [th[0].string, td[0].string, td[1].string, td[2].string, td[3].string, th[1].contents[0].string]
listx.append(listline)
#初始化表格的行和列
ui.tableWidget.setColumnCount(6)
ui.tableWidget.setRowCount(len(listx))
line = 0
# 遍历每行的元素并写入
for i in listx:
for j in range(6):
# print(list[i])
ui.tableWidget.setItem(line, j, QTableWidgetItem(i[j]))
line+=1
def compute(listx):
summ = 0.0
for i in listx:
arr.append(i[1])
# 画图的横坐标数组
for k in listx:
arrx.append(k[0])
#画图的纵坐标数组
for n in arr:
arry.append(eval(n))
for j in arr:
summ += eval(j) #数组里的每个元素都是str类型了,所以要转为数字类型
avg = summ/len(arr)
ui.textBrowser.setText(max(arr))
ui.textBrowser_2.setText(min(arr))
ui.textBrowser_3.setText(str(avg))
# print(arrx)
# print(len(arrx))
# print(arry)
# print(len(arry))
# print(type(max(arr)))
# print(min(arr))
# print(avg)
def gethtml(gupiao,date,page):
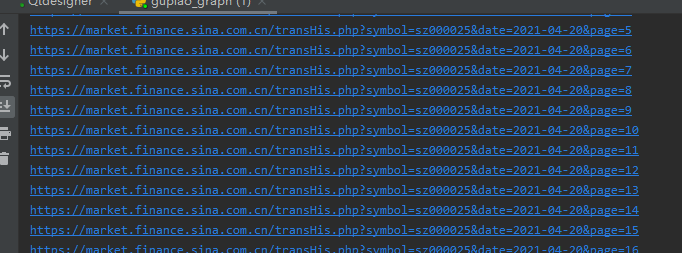
url = 'https://market.finance.sina.com.cn/transHis.php?symbol=' + gupiao + '&date=' + date + '&page=' + str(page)
print(url)
try:
r = requests.get(url=url, headers=headers)
r.raise_for_status()
r.encoding = r.apparent_encoding
flag = get_message(r.text, page)
if flag == 0:
return 0
except Exception as result:
print("错误原因:", result)
return 0
def graph(x, y):
xdict = dict(enumerate(x))
win = pg.GraphicsLayoutWidget(show=True, title="Basic plotting examples")
win.resize(600, 400)
stringaxis = pg.AxisItem(orientation='bottom')
stringaxis.setTicks([xdict.items()])
# win.setWindowTitle('pyqtgraph example: Plotting')
# Enable antialiasing for prettier plots
p1 = win.addPlot(axisItems={
'bottom': stringaxis})
p1.plot(list(xdict.keys()), y)
pg.setConfigOptions(antialias=True)
pg.show()
def mainexe():
# gupiao = input("请输入你想要查询的股票(例如sz000001):")
# date = input("请输入你想要查询的日期(格式为2021-04-27):")
gupiao= ui.lineEdit.text()
date = ui.lineEdit_2.text()
for i in range(1, 1000):
# 返回如果是0则说明爬取错误或者到达尾页,要跳出循环
flag = gethtml(gupiao, date, i)
# 间隔2s爬取
time.sleep(2)
if flag == 0:
break
#计算股票单价平均值最大值最小值
compute(listx)
graph(arrx,arry)
if __name__ == '__main__':
app = QApplication(sys.argv)
MainWindow = QMainWindow()
ui = gupiao.Ui_Form()
ui.setupUi(MainWindow)
MainWindow.show()
ui.pushButton.clicked.connect(mainexe)
pg.exec()
sys.exit(app.exec_())
图形py文件
还是上一篇博客的那个【gupiao.py】
# -*- coding: utf-8 -*-

# Form implementation generated from reading ui file 'gupiao.ui'
#
# Created by: PyQt5 UI code generator 5.15.4
#
# WARNING: Any manual changes made to this file will be lost when pyuic5 is
# run again.  Do not edit this file unless you know what you are doing.


from PyQt5 import QtCore, QtGui, QtWidgets


class Ui_Form(object):
    def setupUi(self, Form):
        Form.setObjectName("Form")
        Form.resize(629, 426)
        Form.setMinimumSize(QtCore.QSize(629, 0))
        self.widget = QtWidgets.QWidget(Form)
        self.widget.setGeometry(QtCore.QRect(50, 10, 521, 401))
        self.widget.setObjectName("widget")
        self.verticalLayout_2 = QtWidgets.QVBoxLayout(self.widget)
        self.verticalLayout_2.setContentsMargins(0, 0, 0, 0)
        self.verticalLayout_2.setObjectName("verticalLayout_2")
        self.horizontalLayout_3 = QtWidgets.QHBoxLayout()
        self.horizontalLayout_3.setObjectName("horizontalLayout_3")
        self.verticalLayout = QtWidgets.QVBoxLayout()
        self.verticalLayout.setObjectName("verticalLayout")
        self.horizontalLayout = QtWidgets.QHBoxLayout()
        self.horizontalLayout.setObjectName("horizontalLayout")
        self.label = QtWidgets.QLabel(self.widget)
        self.label.setObjectName("label")
        self.horizontalLayout.addWidget(self.label)
        self.lineEdit = QtWidgets.QLineEdit(self.widget)
        self.lineEdit.setObjectName("lineEdit")
        self.horizontalLayout.addWidget(self.lineEdit)
        self.verticalLayout.addLayout(self.horizontalLayout)
        self.horizontalLayout_2 = QtWidgets.QHBoxLayout()
        self.horizontalLayout_2.setObjectName("horizontalLayout_2")
        self.label_2 = QtWidgets.QLabel(self.widget)
        self.label_2.setObjectName("label_2")
        self.horizontalLayout_2.addWidget(self.label_2)
        self.lineEdit_2 = QtWidgets.QLineEdit(self.widget)
        self.lineEdit_2.setObjectName("lineEdit_2")
        self.horizontalLayout_2.addWidget(self.lineEdit_2)
        self.verticalLayout.addLayout(self.horizontalLayout_2)
        self.horizontalLayout_3.addLayout(self.verticalLayout)
        self.pushButton = QtWidgets.QPushButton(self.widget)
        self.pushButton.setObjectName("pushButton")
        self.horizontalLayout_3.addWidget(self.pushButton)
        self.verticalLayout_2.addLayout(self.horizontalLayout_3)
        self.tableWidget = QtWidgets.QTableWidget(self.widget)
        self.tableWidget.setMaximumSize(QtCore.QSize(16777215, 291))
        self.tableWidget.setObjectName("tableWidget")
        self.tableWidget.setColumnCount(6)
        self.tableWidget.setRowCount(0)
        item = QtWidgets.QTableWidgetItem()
        self.tableWidget.setHorizontalHeaderItem(0, item)
        item = QtWidgets.QTableWidgetItem()
        self.tableWidget.setHorizontalHeaderItem(1, item)
        item = QtWidgets.QTableWidgetItem()
        self.tableWidget.setHorizontalHeaderItem(2, item)
        item = QtWidgets.QTableWidgetItem()
        self.tableWidget.setHorizontalHeaderItem(3, item)
        item = QtWidgets.QTableWidgetItem()
        self.tableWidget.setHorizontalHeaderItem(4, item)
        item = QtWidgets.QTableWidgetItem()
        self.tableWidget.setHorizontalHeaderItem(5, item)
        self.verticalLayout_2.addWidget(self.tableWidget)
        self.horizontalLayout_7 = QtWidgets.QHBoxLayout()
        self.horizontalLayout_7.setObjectName("horizontalLayout_7")
        self.horizontalLayout_4 = QtWidgets.QHBoxLayout()
        self.horizontalLayout_4.setObjectName("horizontalLayout_4")
        self.label_3 = QtWidgets.QLabel(self.widget)
        self.label_3.setObjectName("label_3")
        self.horizontalLayout_4.addWidget(self.label_3)
        self.textBrowser = QtWidgets.QTextBrowser(self.widget)
        self.textBrowser.setMaximumSize(QtCore.QSize(101, 21))
        self.textBrowser.setObjectName("textBrowser")
        self.horizontalLayout_4.addWidget(self.textBrowser)
        self.horizontalLayout_7.addLayout(self.horizontalLayout_4)
        self.horizontalLayout_5 = QtWidgets.QHBoxLayout()
        self.horizontalLayout_5.setObjectName("horizontalLayout_5")
        self.label_4 = QtWidgets.QLabel(self.widget)
        self.label_4.setObjectName("label_4")
        self.horizontalLayout_5.addWidget(self.label_4)
        self.textBrowser_2 = QtWidgets.QTextBrowser(self.widget)
        self.textBrowser_2.setMaximumSize(QtCore.QSize(89, 21))
        self.textBrowser_2.setObjectName("textBrowser_2")
        self.horizontalLayout_5.addWidget(self.textBrowser_2)
        self.horizontalLayout_7.addLayout(self.horizontalLayout_5)
        self.horizontalLayout_6 = QtWidgets.QHBoxLayout()
        self.horizontalLayout_6.setObjectName("horizontalLayout_6")
        self.label_5 = QtWidgets.QLabel(self.widget)
        self.label_5.setObjectName("label_5")
        self.horizontalLayout_6.addWidget(self.label_5)
        self.textBrowser_3 = QtWidgets.QTextBrowser(self.widget)
        self.textBrowser_3.setMaximumSize(QtCore.QSize(99, 21))
        self.textBrowser_3.setObjectName("textBrowser_3")
        self.horizontalLayout_6.addWidget(self.textBrowser_3)
        self.horizontalLayout_7.addLayout(self.horizontalLayout_6)
        self.verticalLayout_2.addLayout(self.horizontalLayout_7)

        self.retranslateUi(Form)
        QtCore.QMetaObject.connectSlotsByName(Form)

    def retranslateUi(self, Form):
        _translate = QtCore.QCoreApplication.translate
        Form.setWindowTitle(_translate("Form", "Form"))
        self.label.setText(_translate("Form", "股票代码:"))
        self.label_2.setText(_translate("Form", "日期(2021-04-20):"))
        self.pushButton.setText(_translate("Form", "查询"))
        item = self.tableWidget.horizontalHeaderItem(0)
        item.setText(_translate("Form", "成交时间"))
        item = self.tableWidget.horizontalHeaderItem(1)
        item.setText(_translate("Form", "成交价"))
        item = self.tableWidget.horizontalHeaderItem(2)
        item.setText(_translate("Form", "价格变动"))
        item = self.tableWidget.horizontalHeaderItem(3)
        item.setText(_translate("Form", "成交量(手)"))
        item = self.tableWidget.horizontalHeaderItem(4)
        item.setText(_translate("Form", "成交额(元)"))
        item = self.tableWidget.horizontalHeaderItem(5)
        item.setText(_translate("Form", "性质"))
        self.label_3.setText(_translate("Form", "最大值:"))
        self.label_4.setText(_translate("Form", "最小值:"))
        self.label_5.setText(_translate("Form", "平均值:"))
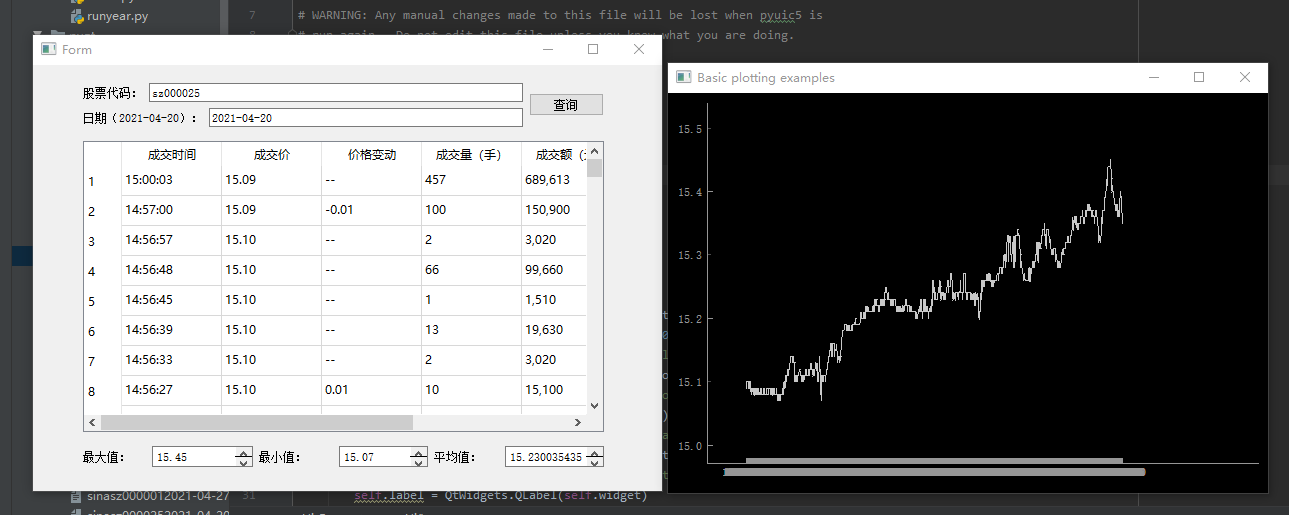
运行结果截图
问题体会
- 刚开始一个人摸索,然后摸索不出来,就去找室友讨论,还真讨论出东西了。画图可以用pyqtgraph。可以运行里面example例子代码,找到自己想要的图表。
import pyqtgraph.examples
pyqtgraph.examples.run()
- 我选择的是一个array_plotting这个折线图。原码是这样的:
import numpy as np
import pyqtgraph as pg

#app = pg.mkQApp("Plotting Example")
# mw = QtGui.QMainWindow()
# mw.resize(800,800)

win = pg.GraphicsLayoutWidget(show=True, title="Basic plotting examples")
win.resize(600,400)
win.setWindowTitle('pyqtgraph example: Plotting')

# Enable antialiasing for prettier plots
pg.setConfigOptions(antialias=True)

p1 = win.addPlot(title="Basic array plotting", y=np.random.normal(size=100))

if __name__ == '__main__':
    pg.exec()
- 需要弄明白每行代码的含义:
addPlot是创建这个图表,win是创建窗口。还有一个Plot,是用于添加坐标轴以及坐标的,上面代码有演示。 注意:添加坐标的时候要是数字类型的!!!!千万别字符串!!!。可以参考这篇博客将字符串转换为数字(是指一些实在没法手动转换的时候,比如日期之类的字符串他还有冒号),当然也可以自己手动转。https://stackoverflow.com/questions/31775468/show-string-values-on-x-axis-in-pyqtgraph - 但是也有一些小问题,刚开始是怎么都出不来图形的小窗口,我以为是进程的问题,(现在也不知道)。然后就依葫芦画瓢添加了一行
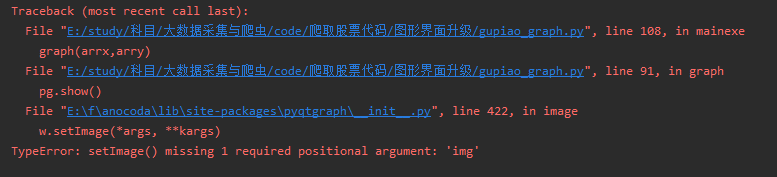
pg.show(),不是出不来吗?那就让你show出来呗。还真的出来了,也运行完成了,没有啥大问题。 - 唯一的不足就是这个莫名的报错,不过好像也没影响到啥
转换为数字(是指一些实在没法手动转换的时候,比如日期之类的字符串他还有冒号),当然也可以自己手动转。https://stackoverflow.com/questions/31775468/show-string-values-on-x-axis-in-pyqtgraph
- 但是也有一些小问题,刚开始是怎么都出不来图形的小窗口,我以为是进程的问题,(现在也不知道)。然后就依葫芦画瓢添加了一行
pg.show(),不是出不来吗?那就让你show出来呗。还真的出来了,也运行完成了,没有啥大问题。 - 唯一的不足就是这个莫名的报错,不过好像也没影响到啥