ATAC-seq数据质量评估注意
ENCODE的ATACseq数据标准。
Uniform Processing Pipeline Restrictions
- The
read lengthprior to any trimming should be a minimum of45 base pairs. - Sequencing may be
paired- orsingle-ended,sequencing typeis specified andpaired sequencesare indicated. - All
Illumina platformsare supported for use in the uniform pipeline, thoughdata from different platforms should be processed separately; colorspace (SOLiD) reads arenotsupported. Barcodes, if present in the fastq, must beindicated.Library insert sizerange must beindicated.
Current Standards
- 必须有两次或更多次
生物学重复(稀有样本也必须做两次技术重复) - 每次重复要有25million非冗余,非线粒体,能够回帖的fragment(单端25 million reads,
双端50 million reads=25 million fragment) - 回帖率>95%, >80%可接受。
- 用
IDR(Irreproducible Discovery Rate)计算重复一致性,rescue和self consisty ratios 都>2 - 用以下指标控制PCR扩增对文库复杂性的影响:
Non-Redundant Fraction (NRF)and PCR Bottlenecking Coefficients 1 and 2, or PBC1 and PBC2:NRF>0.9, PBC1>0.9, PBC2>3 - peak文件必须满足如下要求:
每个重复peak数>150000,>100000可接受(ENCODE的ATAC-seq的peak file没法用)
IDR peak>70000,>50000可接受
要存在无核小体区NFR
存在单核小体峰,好的ATACseq数据应包含核小体,既能看开放染色质,又能看核小体
- The fraction of reads in called peak regions(FRip score)>0.3,>0.2 可以接受。对于稀有样本不要求FRiP但TSS富集还是要作为关键的衡量信噪比的指标。
- TSS富集分数阈值与参考基因组相关。
ATACseq 主干分析流程
reference:
1.文章:https://peerj.com/articles/4040/
2.CHIPseq课程:https://github.com/hbctraining/In-depth-NGS-Data-Analysis-Course/tree/master/sessionV/lessons
3.Harvard FAS Informatics - ATAC-seq Guidelines:https://informatics.fas.harvard.edu/atac-seq-guidelines.html
Harvard FAS Informatics - ATAC-seq Guidelines
Experimental design
- Replicates
- Controls:一般
不设置对照。作用有限,费用。没有转座酶处理的样本测序 - PCR amplification:
尽可能少地使用PCR循环来扩增样本,减少干扰 - Sequencing depth:最佳测序深度取决于
参考基因组的大小和预期染色质的开放程度。人类样本的研究推荐每个样本超过5000万个reads。 - Sequencing mode:(1) ATACseq推荐使用paired-end。paired-end sequencing, helps to
reduce these alignment ambiguities. (2) we are interested inknowing both ends of the DNA fragments generated by the assay, since the ends indicate where the transposase inserted. (3)PCR duplicates are identified more accurately. PCR duplicates areartifacts of the procedure, and they should be removed as part of the analysis pipeline .Computational programs that remove PCR duplicates typically identify duplicates based on comparing ends of aligned reads. Withsingle-end reads, there isonly one position to compare, and so anyreads whose 5' ends match are considered duplicates. Thus,many false positivesmay result, and perfectlygood reads are removedfrom further analysis.Paired-end sequencing,both ends of the original DNA fragments are defined.To be declared a duplicate, both ends of one fragment need to match both ends of another fragment, which is farless likely to occur by chance. Therefore, paired-end sequencing leads tofewer false positives. - Mitochondria: 众所周知ATAC-seq数据通常包含很大比例的
来自线粒体DNA的reads(线粒体DNA是裸露的,也可以被Tn5酶识别切割,植物叶绿体)。线粒体基因组中没有ATAC-seq感兴趣的峰,这些reads在计算中被丢弃,浪费测序资源。可在测序前使用洗涤剂去除样本中的线粒体。
Quality control
FastQC
Process a file of 20 million reads in about 5 minutes with less than 250MB memory used. Quality scores, GC levels, PCR duplicates, and adapter content.
Adapter removal
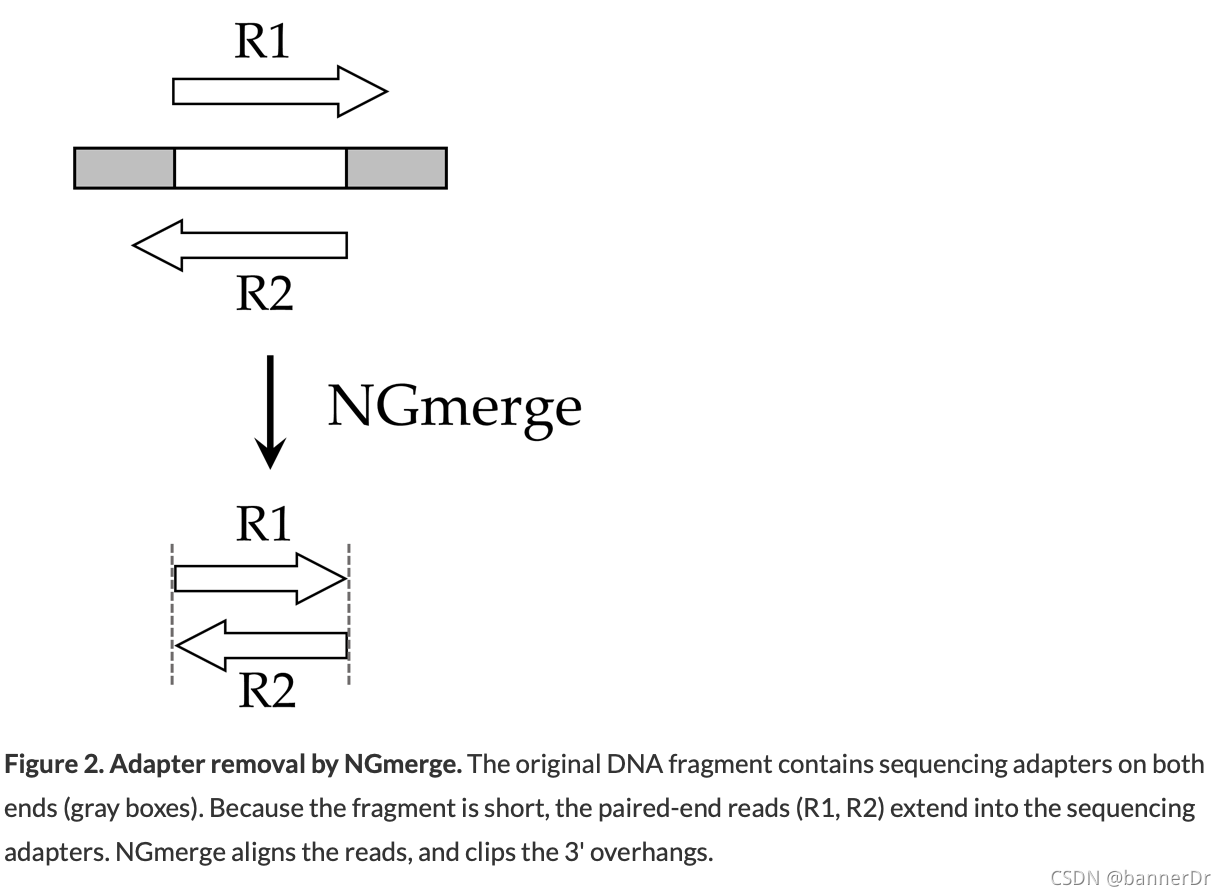
For reads derived from short DNA fragments, the 3' ends may contain portions of the Illumina sequencing adapter.
Cutadapt
NGmerge
Unlike cutadapt, NGmerge does not require that the adapter sequences be provided, nor does it require a parameter for the minimum length of adapter to match (in fact, it does not perform adapter matching at all).For input files of 20 million paired reads, NGmerge should run in less than one hour on a single core, with minimal memory usage.
Just adapter removal
Other than adapter removal, we do not recommend any trimming of the reads. Such adjustments can complicate later steps, such as the identification of PCR duplicates.
Alignment
Two of the most popular alignment program are BWA and Bowtie2.
Genome indexing
For many model organisms, the genome and pre-built reference indexes are available from iGenomes.
Otherwise, Bowtie2 indexes are made from a FASTA genome file using the program bowtie2-build:
bowtie2-build <genome.fa> <genomeIndexName>
Alignment
Bowtie2 parameters. Here are a few that may benefit the alignment of an ATAC-seq dataset :
-X <int> : Maximum DNA fragment length (default 500bp). If you anticipate that you may have DNA fragments longer than the default value, you should increase this parameter accordingly; otherwise, alignments from such fragments are considered not properly paired (see Fig. 3B below).
--very-sensitive : Bowtie2 has a number of alignment and effort parameters that interact in complex (and sometimes unexpected) ways. Preset collections of these parameters are provided for convenience; the default is --sensitive, but better alignment results are frequently achieved with --very-sensitive.
-k <int> : Maximum number of alignments to report per read. By default, Bowtie2 reports at most one alignment per read, and if multiple equivalent alignments exist, it chooses one randomly.
-p <int> : Number of cores on which to run
bowtie2  --very-sensitive  -k 10  -x <genomeIndexName>  -1 <name>_1.fastq.gz  -2 <name>_2.fastq.gz  \
  |  samtools view  -u  -  \
  |  samtools sort  -n  -o <BAM>  -
- For input files of
20 millionpaired reads, this command takes aroundfive hourson Cannon(1 core too slow). One could specify eight cores for Bowtie2 with-p 8and adjust the request in theSLURM scriptto#SBATCH -n 10(that is,eightcores forBowtie2andone eachforSAMtools viewandsort). - Bowtie2 also provides (via stderr) a summary of the mapping results, separated according to uniqueness and alignment type.
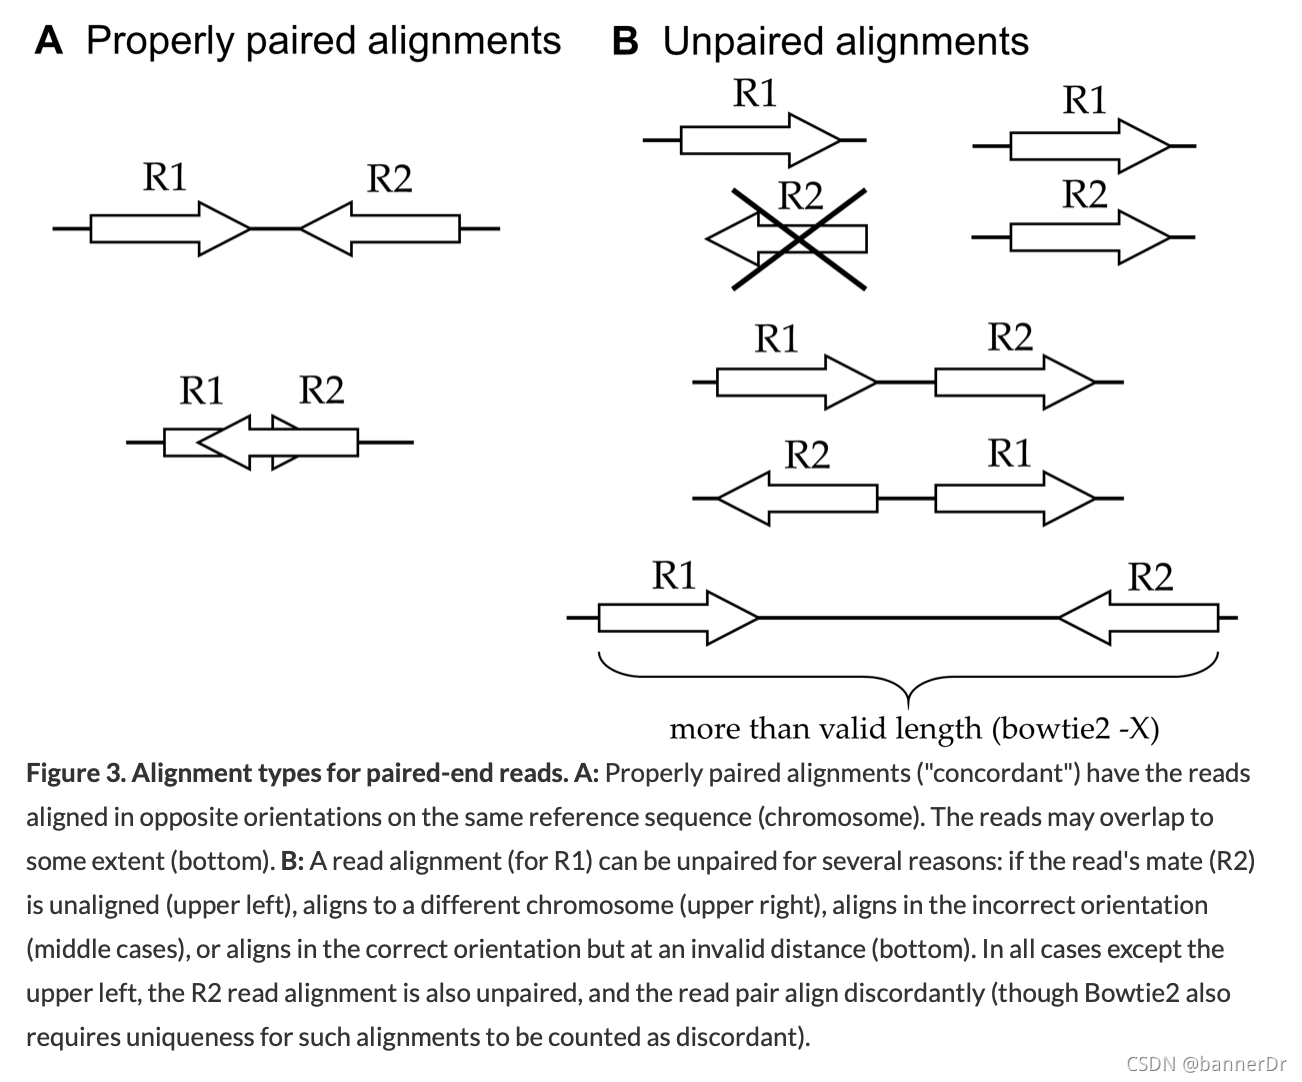
Alignment types for paired-end reads. A: Properly paired alignments ("concordant") have the reads aligned in opposite orientations on the same reference sequence (chromosome). The reads may overlap to some extent (bottom). B: A read alignment (for R1) can be unpaired for several reasons: if the read’s mate (R2) is unaligned (upper left), aligns to a different chromosome (upper right), aligns in the incorrect orientation (middle cases), or aligns in the correct orientation but at an invalid distance (bottom). In all cases except the upper left, the R2 read alignment is also unpaired, and the read pair align discordantly (though Bowtie2 also requires uniqueness for such alignments to be counted as discordant).
Generich 版本
Peak calling
推荐新的Generich???
Genrich was designed to be able to run all of the post-alignment steps through peak-calling with one command. It also possesses a few novel features. Consider the following attributes:
- Removal of mitochondrial reads. Genrich
disregards all alignments to the mitochondrialchromosome with-e chrM. - Removal of PCR duplicates. Genrich follows a
systematic proceduretoremove PCR duplicateswith-r. Note that this evaluationtakes into account multimapping reads(see next), which isnot provided by other alignment-based duplicate-removal programs, such asPicard's MarkDuplicates.
Analysis of multimapping reads. 重复区域多的基因组可能导致非唯一mapping。 Non-uniquely aligned reads can be removed by filtering based on MAPQ scores withsamtools, but this effectively renders certain genomic regions inaccessible to the assay. With Genrich,reads with multiple alignments are analyzedby adding a fractional count to each location. Genrich’sstatistical modelaccommodates these values.
Along these same lines, Genrich considers the entire reference genome to be part of the assay. If there are chromosomes or genomic regions that should be excluded from analysis, these can be specified by-e or -E, and Genrich will adjust thegenome length calculationaccordingly. There is no need toguesstimate an "effective" genome sizelike with MACS2.
Analysis of multiple replicates. When alignment files for multiple replicates are provided to Genrich, itcalls peaks for the replicates collectively.No more IDR. Done.
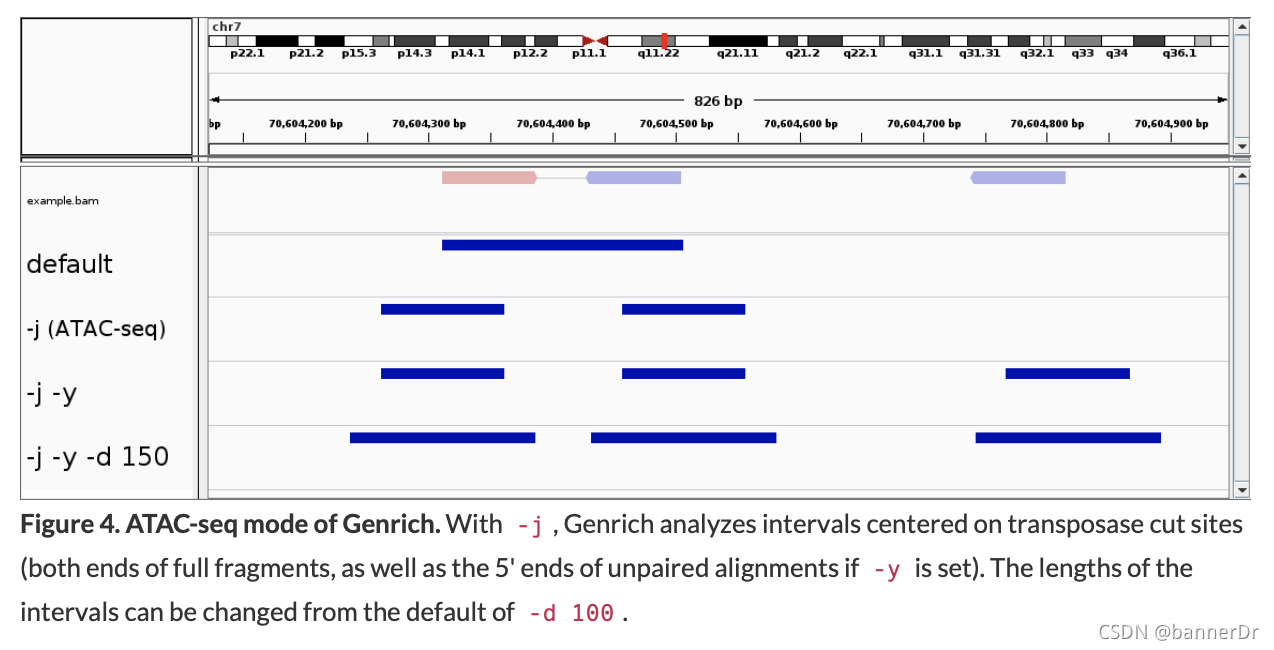
Interpretation of alignments suitable for ATAC-seq. Genrich provides an ATAC-seq analysis mode (-j) in which, rather than inferring the full fragments from the alignments, intervals are interpreted that are centered on transposase cut sites (the ends of each DNA fragment). Only properly paired alignments are analyzed by default, but there is an option to consider unpaired alignments as well (-y) (Fig. 4).
- Our previous recommendation was to run
MACS2with-f BAMPE, which is similar to thedefault analysis mode of Genrich(inferring full fragments, rather than cut site intervals). Others have attempted to interpret cut site intervals with MACS2 by using the--shift and--extsizearguments, but these arguments are ignored inBAMPEmode. They do work in the default (BAM) mode, but then, with paired-end reads,most of the alignments are automatically discarded(half of the properly paired alignments and all of the unpaired alignments; secondary alignments are never considered). Is it worse to interpret full fragments that may be less informative biologically, or to disregard more than half of the sequence data? A complicated question. The correct answer is: use Genrich.
Genrich
most important parameters and options of Genrich for analyzing ATAC-seq:
-j : ATAC-seq mode (must be specified)
-d <int> : Expand cut sites to the given length (default 100bp)
-y : Analyze unpaired alignments
-r : Remove PCR duplicates
-e <arg> : Chromosomes (reference sequences) to exclude. Can be a comma-separated list, e.g. -e chrM,chrY.
-E <file> : Input BED file(s) of genomic regions to exclude, such as ‘N’ homopolymers or high mappability regions
-q <float> : Maximum q-value (FDR-adjusted p-value) for peak calling (default 0.05). An unadjusted p-value threshold can be used instead with -p <float>.
-a <float> : Minimum area under the curve (total significance) for a peak (default 20.0). Increasing this value results in fewer but higher confidence peaks.
-v : Verbose mode
Genrich -t <BAM> -o <OUT> -j -y -r -e chrM -v
- 对于重复data,
-t <BAM1>,<BAM2>. - The output file produced by Genrich is in
ENCODE narrowPeak format, listing the genomic coordinates of each peak called and various statistics. - Speed: a single BAM containing
146.3 million alignmentswas analyzed by Genrich in10.5minwith17.1GB of memory. In general, input BAM(s) of more alignments take longer to analyze, but the memory usage should not increase greatly. Note thatGenrich is not multithreaded, so it runs on a single core only. - Those who wish to explore the results of varying the
peak-calling parameters (-q/-p, -a, -l, -g)should consider having Genrich produce a log file when it parses the SAM/BAM files (for example, with-f <LOG>added to the above command). Then, Genrich can call peaks directly from the log file with the-Poption(调参数使用此法节省内存和时间):
Genrich -P -f <LOG> -o <OUT2> -p 0.01 -a 200 -v
NEXT Steps
Visualization
For ATAC-seq in model organisms, the peak file produced by Genrich can be uploaded directly to the UCSC genome browser. Add header.
track type=narrowPeak
An alternative visualization tool is the Integrative Genomics Viewer (IGV). Peak files can be loaded directly (File → Load from File). Viewing BAM files with IGV requires that they be sorted by coordinate and indexed using SAMtools. However, the BAMs show the read alignments, not the full fragments generated by the ATAC nor the cut site intervals analyzed by Genrich. To view the intervals, one can use the optional output BED file produced by Genrich with -b.
Comparing peak files
Determining genomic regions that are common or different to a set of peak files is best accomplished with BEDTools, a suite of software tools that enables “genome arithmetic.”
For example, bedtools intersect determines regions that are common to two peak files. Finding differences between two peak files, such as control vs. experimental groups, is accomplished via bedtools subtract.
Annotation
It is helpful to know what genomic features are near the peaks called by Genrich. One program that is commonly used to annotate peaks is ChIPseeker. ChIPseeker was originally designed to be used in the analysis of ChIP-seq, but it works just as well with ATAC-seq.
ChIPseeker requires that the genome of interest be annotated with locations of genes and other features. The ChIPseeker user guide is extremely helpful in using this R/Bioconductor package.
Motif finding
HOMER is a suite of software designed for motif discovery. It takes a peak file as input and checks for the enrichment of both known sequence motifs and de novo motifs.
MACS2版本
Alignment(same)
 bowtie2  --very-sensitive  -x <genomeIndexName>  -1 <name>_1.fastq.gz  -2 <name>_2.fastq.gz \
  |  samtools view -u -  \
  |  samtools sort -  >  <BAM>
Alignment adjustments
Mitochondrial reads
- ATAC-seq datasets usually contain a large percentage of reads that are derived from mitochondrial DNA (discussion). Using CRISPR to reduce mitochondrial contamination. Or recently Omni-ATAC method uses detergents[洗涤剂] to remove mitochondria and is likely to be more accessible for most researchers ( bad computational workflow).
- Method 1 : Remove the mitochondrial genome from the reference genome before aligning the reads. In human/mouse genome builds, the mitochondrial genome is labeled ‘
chrM’. That sequence can be deleted from the reference prior to building the genome indexes. The downside of this approach is that the alignment numbers will look much worse; all of the mitochondrial reads will count as unaligned. [植物?] - Method 2 : Remove the mitochondrial reads after alignment. A python script, creatively named removeChrom, is available in the ATAC-seq module to accomplish this. For example, to remove all ‘chrM’ reads from a BAM file, one would run this:
samtools view -h <inBAM> | removeChrom - - chrM | samtools view -b - > <outBAM>
PCR duplicates
Picard’s MarkDuplicates. The output file specified by M= lists counts of alignments analyzed and duplicates identified.
java -jar $PICARD_TOOLS_HOME/picard.jar MarkDuplicates I=<inBAM> O=<outBAM> M=dups.txt REMOVE_DUPLICATES=true
Non-unique alignments
重复区域多的参考序列可能导致reads多处mapping. 用samtools view的-q 去除非唯一比对. For reads with multiple alignments, Bowtie2 (or BWA) will report only one alignment (by default) and will assign it a low mapping quality (MAPQ) score, which is defined as -10 * log10Pr{mapping position is wrong}. To eliminate alignments with MAPQ < 10 (i.e., where Bowtie2 has determined Pr{mapping position is wrong} > 0.1), one would run the following:
samtools view -b -q 10 <inBAM> > <outBAM>
Peak calling
- Model-based Analysis of ChIP-Seq (MACS2) is a program for detecting regions of
genomic enrichment. Though designed for ChIP-seq, it works justas well on ATAC-seq and other genome-wide enrichment assays that have narrow peaks. The main program in MACS2 iscallpeak, and its options are described below. (Note that the latest version of MACS2 on Odyssey (v2.1.2_dev) is different from the updated official MACS2 release (v2.1.2), although the latter does incorporate many of the bug fixes made in the Odysseyversion?.) - It is important to remember that the
read alignments indicate only a portion of the DNA fragments generated by the ATAC?. Therefore, one must consider how one wants MACS2 to interpret the alignments.
Alignments to analyze
- alignments分为两类:“properly paired” and “singletons” 。
-f选择其类型。 - Analyze only properly paired alignments, but ignore R2 reads and treat R1 reads as singletons. This is the default option (
-f AUTO). MACS2 creates a model of the fragment lengths and extends the 3’ ends of the R1 reads to the calculated average length. An alternative is to skip this model building and instead extend each read to a specified length (e.g.,--nomodel --extsize 300for 300bp fragments). The value of the length parameter is usually determined from the average size during library preparation (the default value is 200bp if no value is specified). However,neither of these approaches utilizes the value of paired-end sequencing, which defines both fragment ends. - Analyze only properly paired alignments with
-f BAMPE. Here, the fragments are defined by the paired alignments’ ends, and there isno modeling or artificial extension. Singleton alignments are ignored. This is thepreferred optionfor using only properly paired alignments. - Analyze all alignments. For this approach, a python script, SAMtoBED, is available in the ATAC-seq module. This script converts the read alignments to BED intervals, treating the properly paired alignments as such and extending the singleton alignments as specified. There are
four options for the singletons: ignore them, keep them as is, extend them to an arbitrary length (similar to the--extsizeoption of MACS2), or extend them to the average length calculated from the properly paired alignments. - Here is an example command, using the “extend to average length” option (
-x):
samtools view -h <BAM> | SAMtoBED -i - -o <BED> -x -v
The output from SAMtoBED is a BED file that should be analyzed by MACS2 with -f BEDPE.
(Note that the BEDTools program
cannot be used here, since its output is in a nonstandard BED format that MACS2 cannot analyze.)
- In deciding among these analysis options, it may help to consider the counts produced by Bowtie2, which indicate
how many alignments fall into each category. For example, if most of the reads are aligned in proper pairs, it may be sufficient to useoption #2. On the other hand,option #3is preferred if a substantial fraction of the reads consists of singletons.
Other arguments
- MACS2 is
not multithreaded
macs2 callpeak -t <BED> -f BEDPE -n NAME -g ce --keep-dup all
-n <str>Name of the sample. The output files name prefix.
-g <int>Effective genome size, the size of the organism’s genome that can be analyzed (not including Ns, repetitive sequences, etc.). This will be less than the actual genome size. Parameters are provided for some model organisms, and thedefault value is hs(for Homo sapiens), which corresponds to a value of 2.7e9.
-q <float>Maximum q-value(FDR-adjusted p-value) for peak calling (default0.05). Reducing this threshold will decrease the number of peaks identified by MACS2 but increase the confidence in the called peaks.
--keep-dup <arg>How to handle PCR duplicates (default: --keep-dup 1, i.e. remove all potential duplicates). If PCR duplicates have been removed by another program, such as Picard’s MarkDuplicates, then specify--keep-dup all.
--max-gap <int>Maximum gap between significant sites to cluster them together (default 50bp). (v2.1.2_dev only)
--min-length <int>Minimum length of a peak (default 100bp). (v2.1.2_dev only)
Output files
- NAME_peaks.xls
- NAME_peaks.narrowPeak
- NAME_summits.bed
- The most useful file is
NAME_peaks.narrowPeak, a plain-textBEDfile that lists thegenomic coordinates of each peak called, along with variousstatistics(fold-change, p- and q-values, etc.).