理解时间序列
Prometheus会将所有采集到的样本数据以时间序列(time-series)的方式保存在内存数据库中,并且定时保存到硬盘上。time-series是按照时间戳和值的序列顺序存放的,我们称之为向量(vector). 每条time-series通过指标名称(metrics name)和一组标签集(labelset)命名。如下所示,可以将time-series理解为一个以时间为Y轴的数字矩阵:
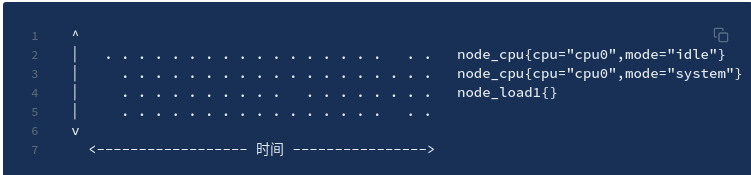
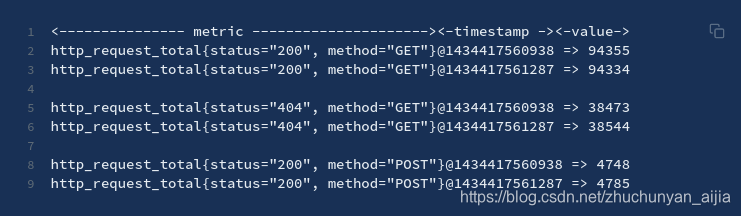
在time-series中的每一个点称为一个样本(sample),样本由以下三部分组成:
-
指标(metric):metric name和描述当前样本特征的labelsets;
-
时间戳(timestamp):一个精确到毫秒的时间戳;
-
样本值(value): 一个float64的浮点型数据表示当前样本的值
函数使用 https://prometheus.fuckcloudnative.io/di-san-zhang-prometheus/di-4-jie-cha-xun/functions#rate
without 和 by
https://zhuanlan.zhihu.com/p/121104877
without用于从计算结果中移除列举的标签,而保留其它标签。by则正好相反,结果向量中只保留列出的标签,其余标签则移除。通过without和by可以按照样本的问题对数据进行聚合。
有点像select sum(xx) from table group by y1,y2
对http_requests_total value group  by  code,handler,job,method 聚合sum
sum(http_requests_total) without (instance)
等价于
sum(http_requests_total) by (code,handler,job,method)
如果只需要计算整个应用的HTTP请求总量,可以直接使用表达式
sum(http_requests_total)

count_values
用于时间序列中每一个样本值(value)出现的次数。count_values会为每一个唯一的样本值输出一个时间序列,并且每一个时间序列包含一个额外的标签。
count_values("count", prometheus_http_requests_total)

topk和bottomk
topk和bottomk则用于对样本值(value)进行排序,返回当前样本值前n位,或者后n位的时间序列。
topk(5, prometheus_http_requests_total)
rate
rate(node_cpu_seconds_total{mode="idle"}[2m])cpu 空闲,2min中平均值

increase函数
increase() 函数表示某段时间内数据的增量
rate() 函数则表示某段时间内数据的平均值
两个函数如何选取使用?
当我们获取数据比较精细的时候 类似于1m取样推荐使用rate()
当我们获取数据比较粗糙的时候 类似于5m,10m甚至更长时间取样推荐使用increase()
increase(node_network_receive_bytes_total{device="eth0"}[1m])更多函数: https://prometheus.io/docs/prometheus/latest/querying/functions/