现代实时应用程序的基本支柱之一是它们的弹性。
因此,为应用程序选择数据库可能是一个真正的挑战。
不同的数据库设计有不同的用途,在这种情况下,关系数据库由于其严格的架构和对数据类型的约束而不能完全满足开发人员的需求。
可以通过使用灵活的数据库来提供弹性,该数据库能够处理大量非结构化数据,并在业务需求突然改变时增加/减少存储容量而不会造成损失。
因此,NoSQL数据库逐渐取代了关系数据库:它们的功能可以应对现代(通常是非结构化)数据的挑战。
MongoDB领先于所有其他NoSQL数据库,并满足在各个开发领域中快速,灵活地访问数据的业务需求,尤其是在实时数据占优势的地方。
好消息是从MongoDB 4开始就支持ACID事务。
0。
可以肯定的是,您可以检查数据库引擎多年来在数据库趋势方面排名的可信样条图,并将MongoDB的使用与其他数据库的使用进行比较。
让我们深入探讨MongoDB的技术方面及其优势。
MongoDB是一个面向文档的数据库。
这意味着所有数据都存储在类似JSON的文档中,这些文档又存储在集合中-与关系数据库中的表类似,但它们之间没有指定的关系。
它针对本地存储文档和其他类型的数据进行了优化。
我想指出MongoDB最引人注目的功能:
- 动态架构
:您无需在创建集合时预先定义架构; 您可以随时更改字段的类型,其数量和文档大小。
因此提供了动态数据模型的创建。
这就是所谓的MongoDB的灵活性。
它在敏捷开发中得到认可。 - 支持
索引编制
,
动态查询
在文档上,以及实时聚合以进行强大的数据分析。 - 可扩展性
。
这意味着您可以轻松地将数据分布在多台服务器上,而不会威胁到其可用性。
关系数据库中使用的方法不能说相同的话。 - 无需将应用程序的业务对象映射到数据库表(例如,在使用JPA的Java中)。
因此,使用数据很容易。 - 支持
自动分片
启用水平缩放。
水平扩展要求添加服务器,其成本通常低于使用功能更强大的CPU(垂直扩展)的成本。
MongoDB在收集级别分片数据。 - 跨平台兼容性。
- 最后但并非最不重要的是:
自由
和 open-source.
However, I should mention that there always existed a trade-off between flexibility and reliability. The latest usually involves ACID compliance and is provided by SQL databases. So it’s up to you what database to choose for your application — a relational or NoSQL one.
If your data is growing and changing its structure once in a while, the natural question arises: how to handle and process all of that data? Here comes in handy the functionality of NoSQL databases and MongoDB in particular. MongoDB is optimized for natively storing documents and their fast accessing by indexing, also, the replication is supported. Therefore it is much faster than its relational competitors. To enhance existing optimization, you can search for different techniques which include using WiredTiger engine, zone-based sharding, choosing short names for fields, etc.
The fact that MongoDB is in favor of such companies as Google, Cisco, SAP, Facebook, Expedia, and others speaks for itself. It is commonly used for real-time analytics, big data, mobile applications, etc. MongoDB is the best decision for unstructured and semi-unstructured data such as:

- Posts in social media
- Web pages
- Emails
- Reports
- Medical records
- Raw data from marketing researches
- Scientific data
- And other
Besides, it greatly copes with storing structured data as well.
Whatever type of data you choose, sometimes it becomes necessary to visualize all the data or its part. When searching for MongoDB data visualization tool, I’ve noticed that it is hard to find the one with out-of-the-box functionality. So today I’ll give you a rundown of the tools which I’ve used together to visualize my data.
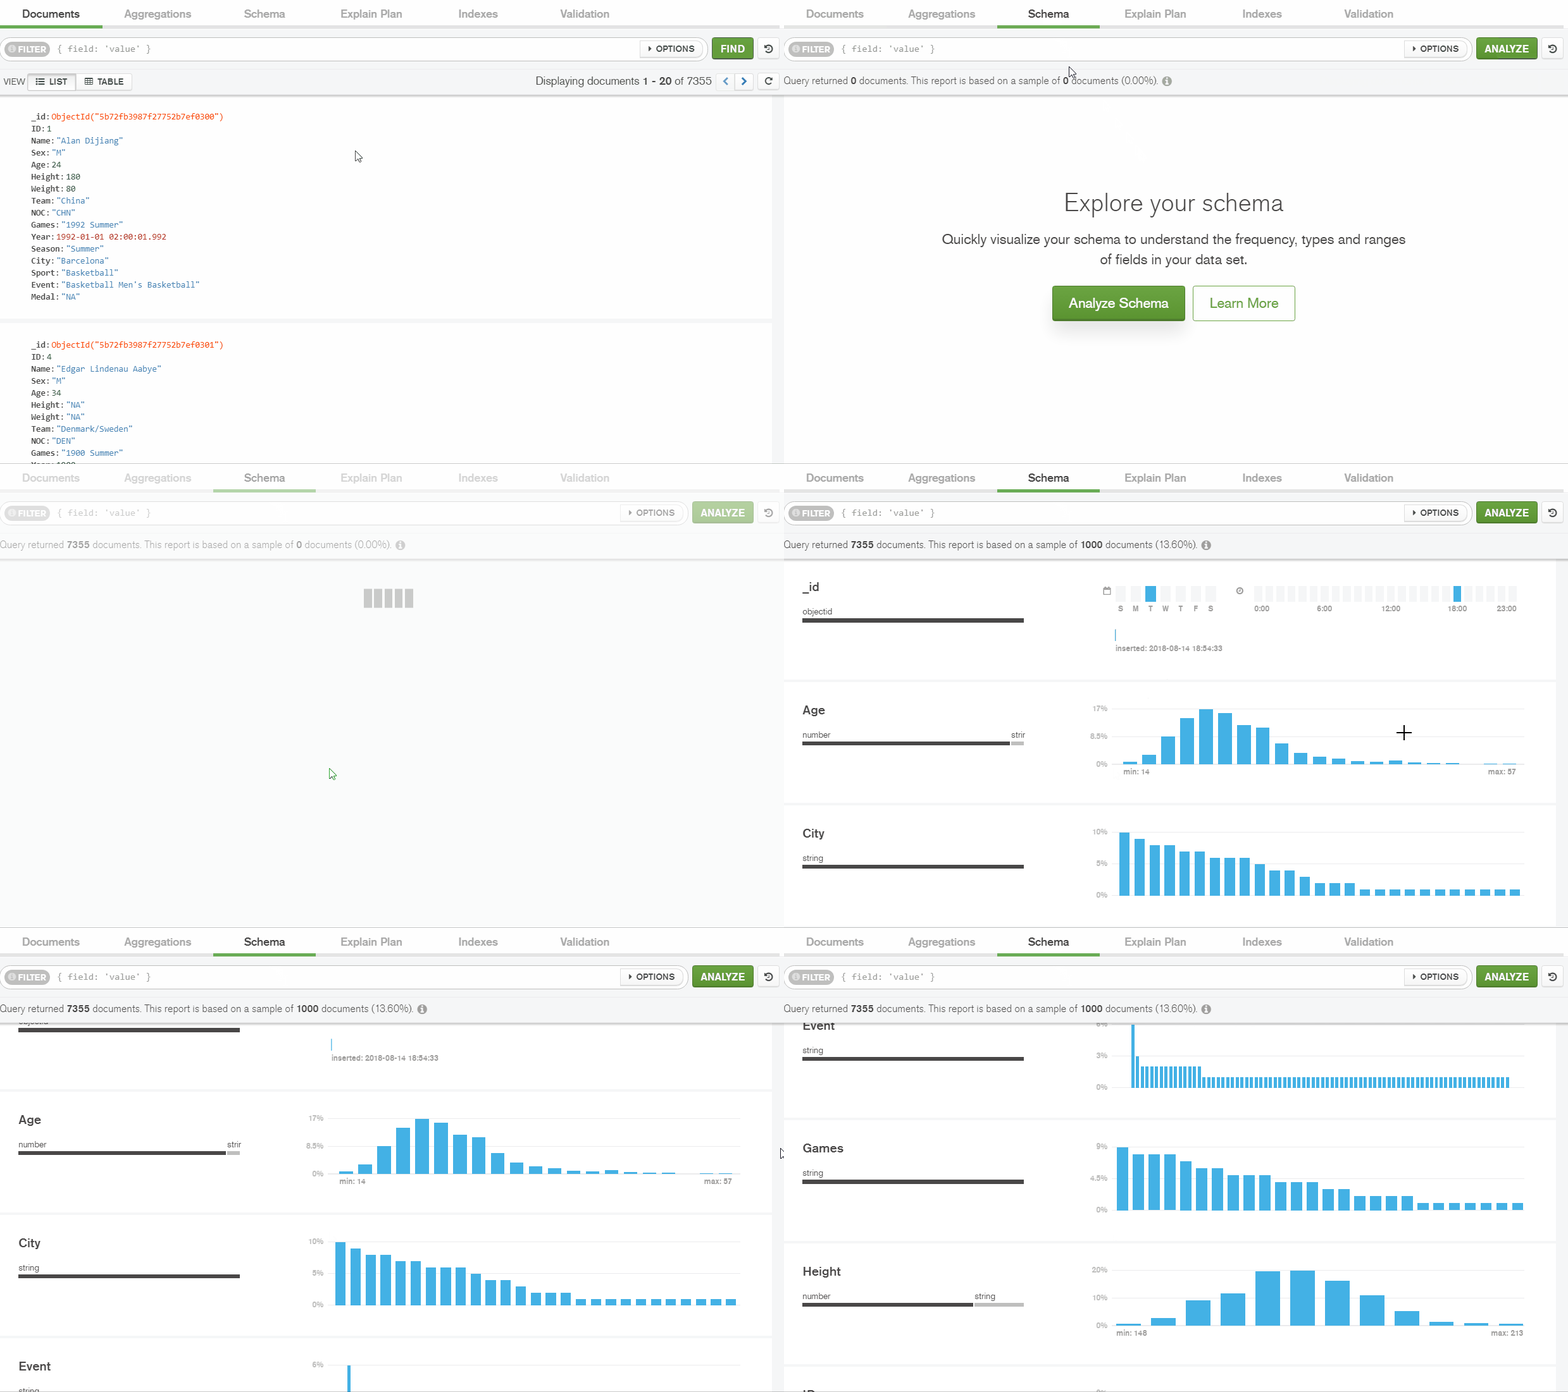
- The first one is Compass, which is a native MongoDB database 数据库异构同步 management GUI application. It is a part of MongoDB Atlas subscription. Nevertheless, Compass offers a free trial during which I’ve managed to fully test the application. I’ve discovered that it is suitable for visualization of MongoDB data and its collection’s schema; editing, adding and deleting data; I’ve used it instead of the mongo Shell and got even better results while working with the data. Also, I’ve used a Schema visualization tool to get the new insights and define the patterns in my dataset. This is what its interface looks like:
 I think it is one of the most powerful parts of Compass because it makes me able to interact with my data in real time, quickly perform simple and complex queries to filter the data and see the specific portions of it, analyze the distribution of data types and fields’ values using generated histograms.
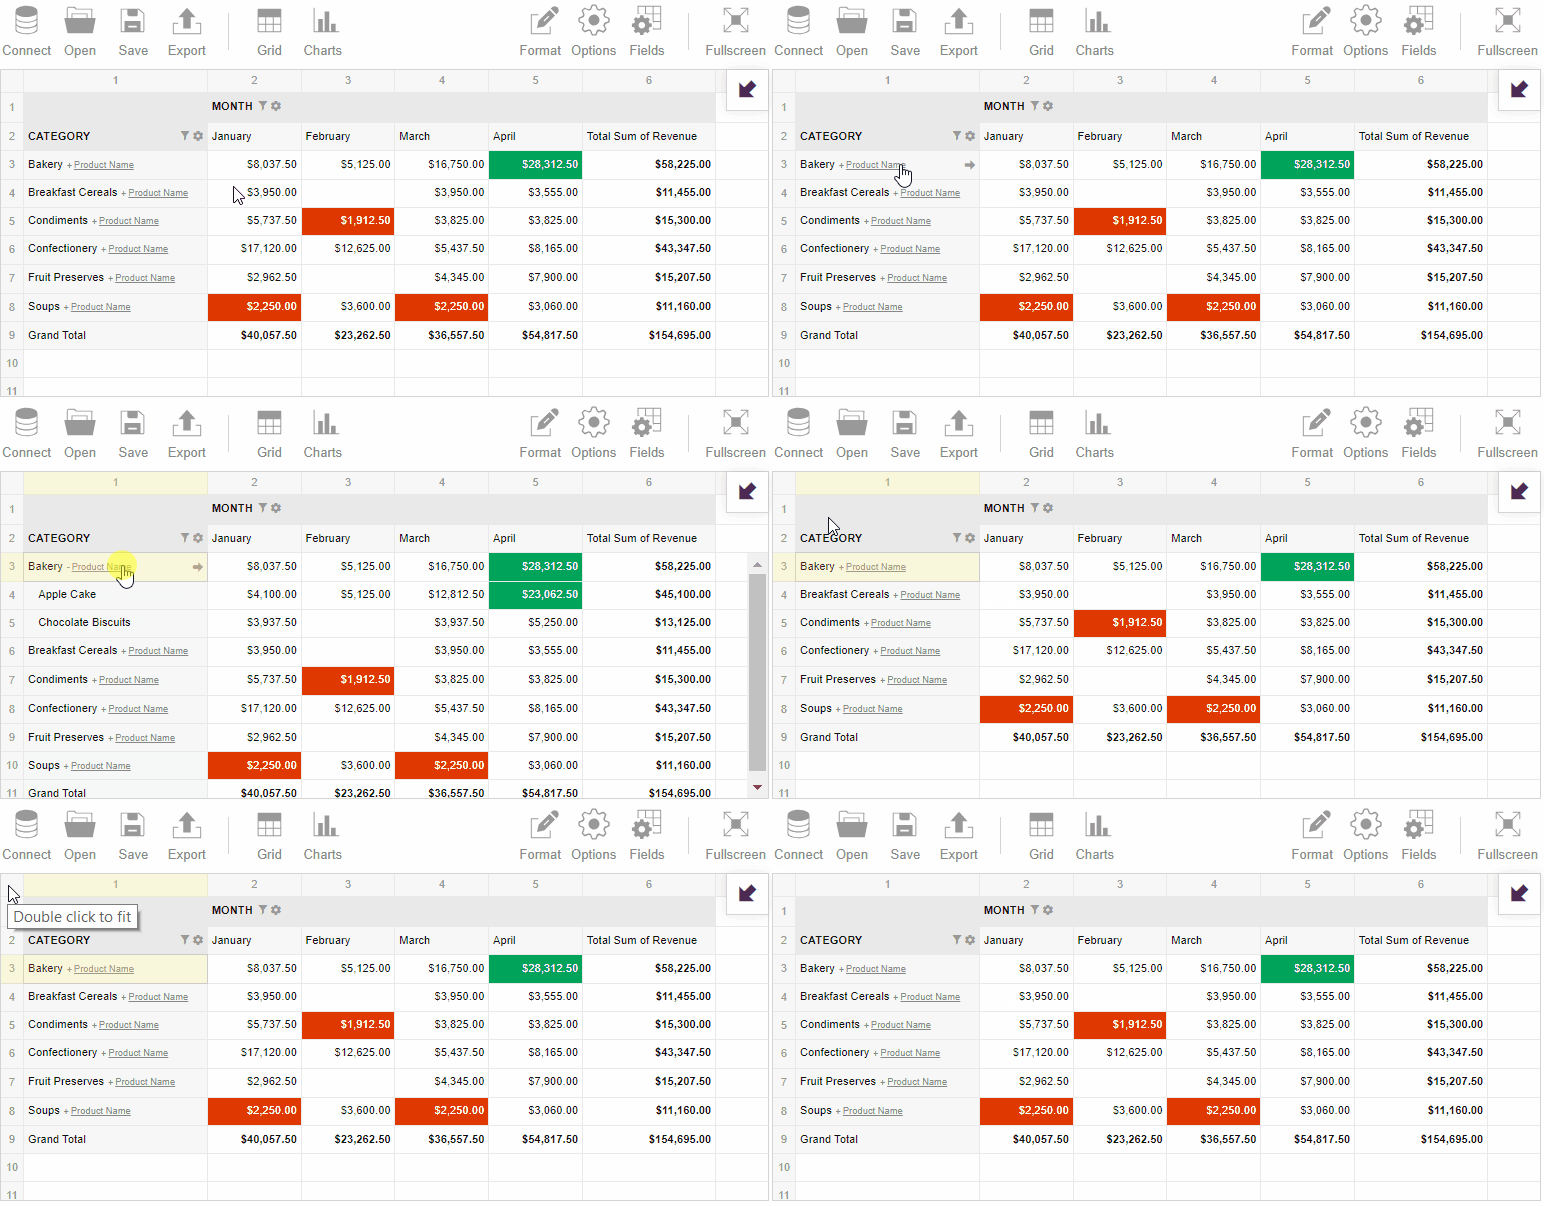
- The second data visualization tool my choice fell on is Flexmonster Pivot Table. It is a component for web reporting and data analysis. It supports connecting to JSON data sources so I created a Node.js application and set up a connection to MongoDB, then loaded my data into the pivot table. Then I analyzed the data applying sorting, filtering, and aggregation via a comfy UI.
Flexmonster offers a free trial that allowed me to evaluate all the features and functionalities.
另外,我注意到,在将Compass作为独立应用程序安装时,Flexmonster需要嵌入到Web应用程序中。
我有一个Angular 4应用程序,有时需要一段时间才能将新工具集成到其中。
但是在文档中,我找到了一个可以帮助我快速完成此任务的教程。
要开始深入了解数据,您可以从MongoDB数据库中请求数据并将其直接加载到数据透视表中。
我已使用本教程将数据获取到我的Node中。
js应用程序。我希望您将尝试使用这两种工具来实现最复杂的MongoDB数据分析目标。
随意尝试Compass和Flexmonster数据透视表,看看它们的功能如何互补。我很想听听您对此评论的反馈。
请让我知道您在评论中的想法。
您使用什么工具进行MongoDB数据可视化?
它们满足您的所有要求吗?