MongoDB可视化监控
目标:可视化显示MongoDB的运行状态。
工具:Grafana,Prometheus
因为grafana本身数据源没有mongodb,所以中间加上Prometheus来对mongodb进行监控。
Prometheus是由SoundCloud开发的开源监控报警系统和时序列数据库,其使用go语言开发。基本原理是通过HTTP协议周期性抓取被监控组件的状态,任意组件只要提供对应HTTP接口就可以接入监控。(报警后续可以加入)
Grafana是一个开源的度量分析和可视化套件,常用于可视化基础设施和应用程序分析的时间序列数据。
部署
需要安装的组件:
Prometheus
Grafana
node_exporter
mongodb_exporter
步骤
安装go环境
$ yum install go
$ go version
go version go1.6.3 linux/amd64
安装Prometheus
$ wget https://github.com/prometheus/prometheus/releases/download/v1.6.2/prometheus-1.6.2.linux-amd64.tar.gz
$ tar xvf prometheus-1.6.2.linux-amd64.tar.gz -C /usr/local/
$ ln -sv /usr/local/prometheus-1.6.2.linux-amd64/ /usr/local/prometheus
$ cd /usr/local/prometheus
修改配置文件
将监管的ip地址添加到prometheus.yml中
scrape_configs:
  # The job name is added as a label `job=<job_name>` to any timeseries scraped from this config.
  - job_name: 'mongo1'
    static_configs:
      - targets: ['10.13.72.26:9001']
其中'10.13.72.26:9001'是mongodb_exporter监听端口,后面安装mongodb_exporter会提到
启动服务
nohup ./prometheus &
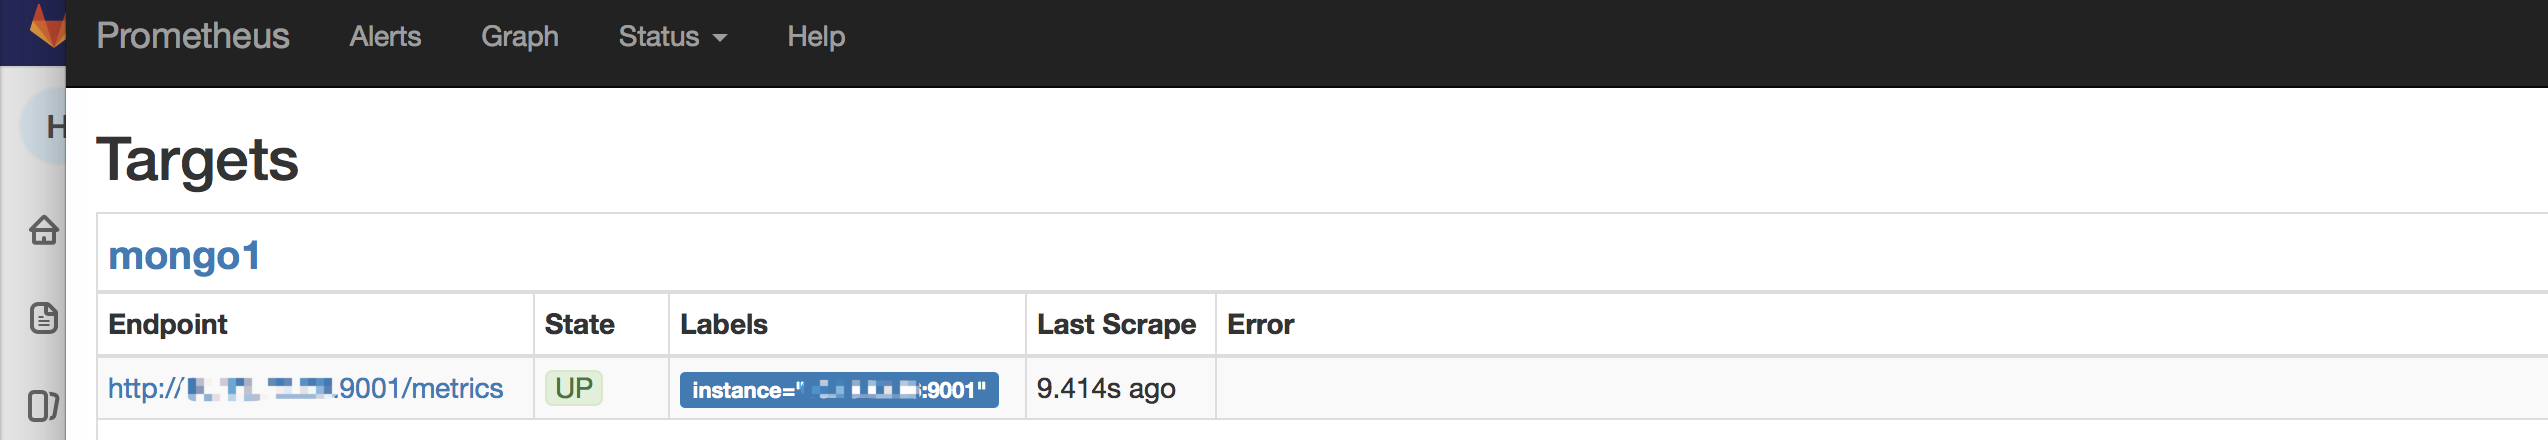
prometheus内置列一个web界面,可以通过http://install_host:9090访问。在Status->Targets页面中,我们可以看到配置的mongo1,状态为Down,说明未检测到数据。如何解决呢?需要安装好node_exporter,mongodb_exporter状态才会变为Up
安装node_exporter
node_exporter服务端agent,用go语言编写,主要用于采集系统数据,如cup,内存,负载,磁盘,网络等信息。
启动后监听9100端口。
$ wget https://github.com/prometheus/node_exporter/releases/download/v0.14.0/node_exporter-0.14.0.linux-amd64.tar.gz
$ tar xvf node_exporter-0.14.0.linux-amd64.tar.gz -C /usr/local/
$ nohup /usr/local/node_exporter-0.14.0.linux-amd64/node_exporter &
安装mongodb_exporter
wget https://github.com/dcu/mongodb_exporter/releases/mongodb_exporter-linux-amd64
nohup ./mongodb_exporter-linux-amd64
启动后占用9001端口
安装grafana
wget https://dl.grafana.com/oss/release/grafana-6.2.5-1.x86_64.rpm
sudo yum localinstall grafana-6.2.5-1.x86_64.rpm
启动后默认占用3000端口
sudo service grafana-server start
grafana显示mongodb数据
步骤1: 打开grafana前端页面http://install_host:3000
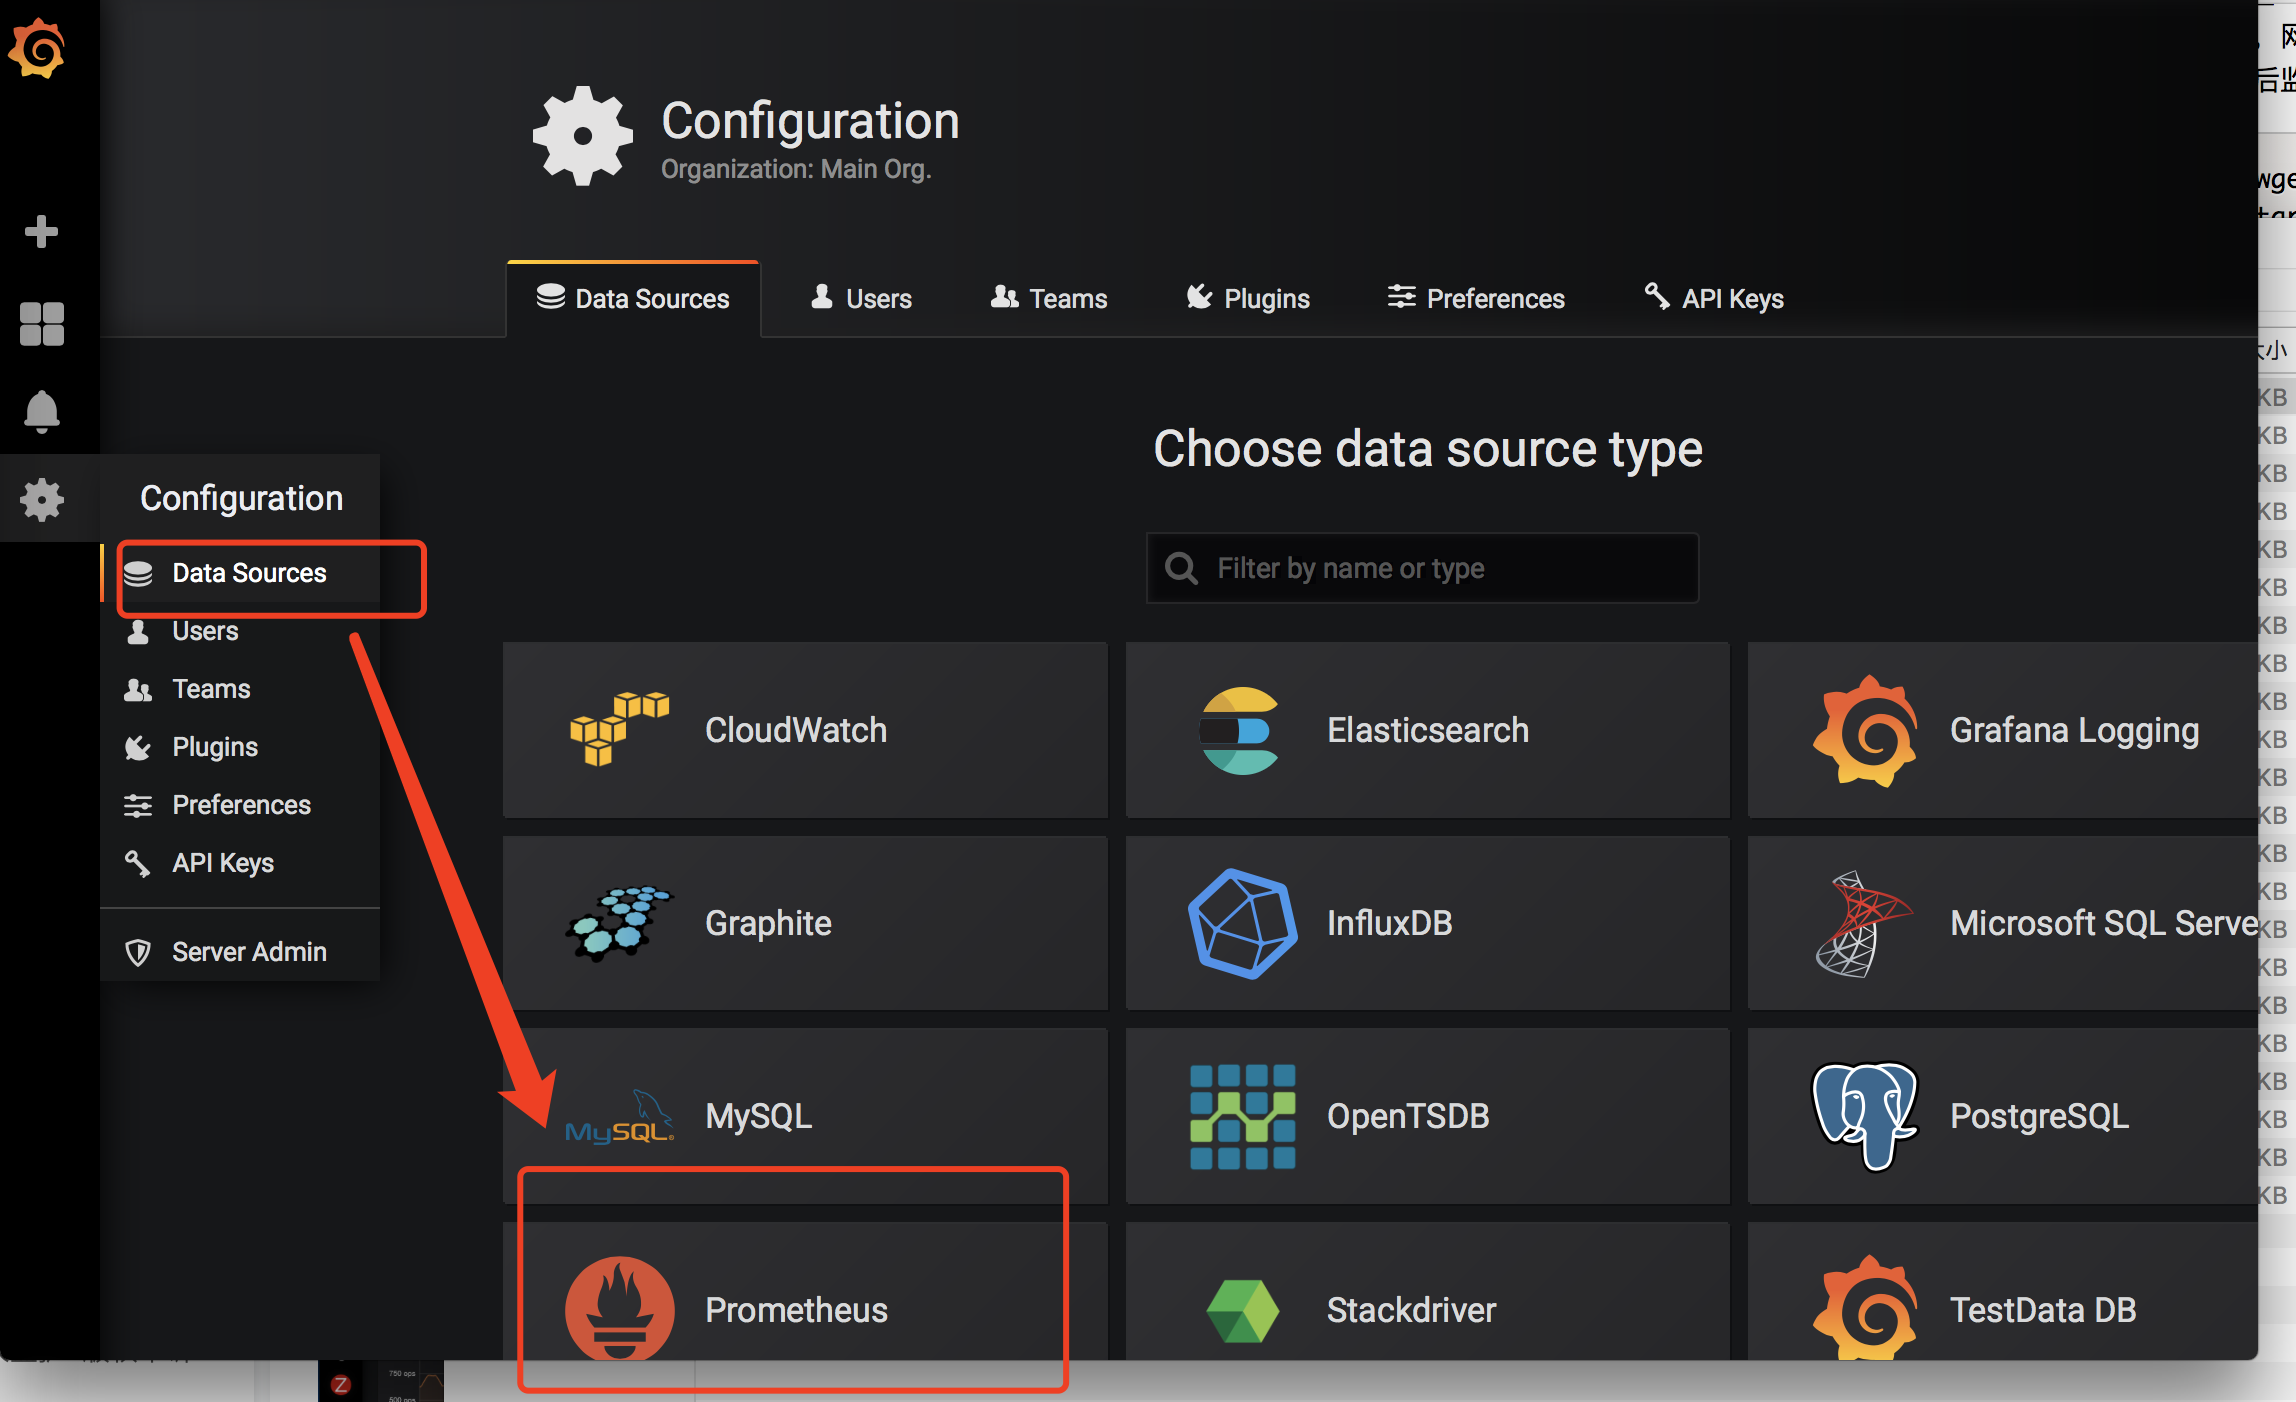
步骤2:在Data Sources添加数据源

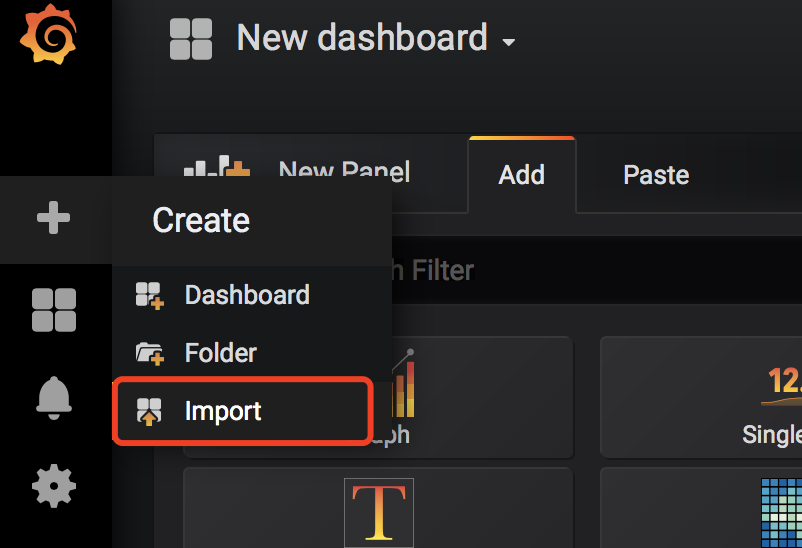
步骤3: Create dashboard
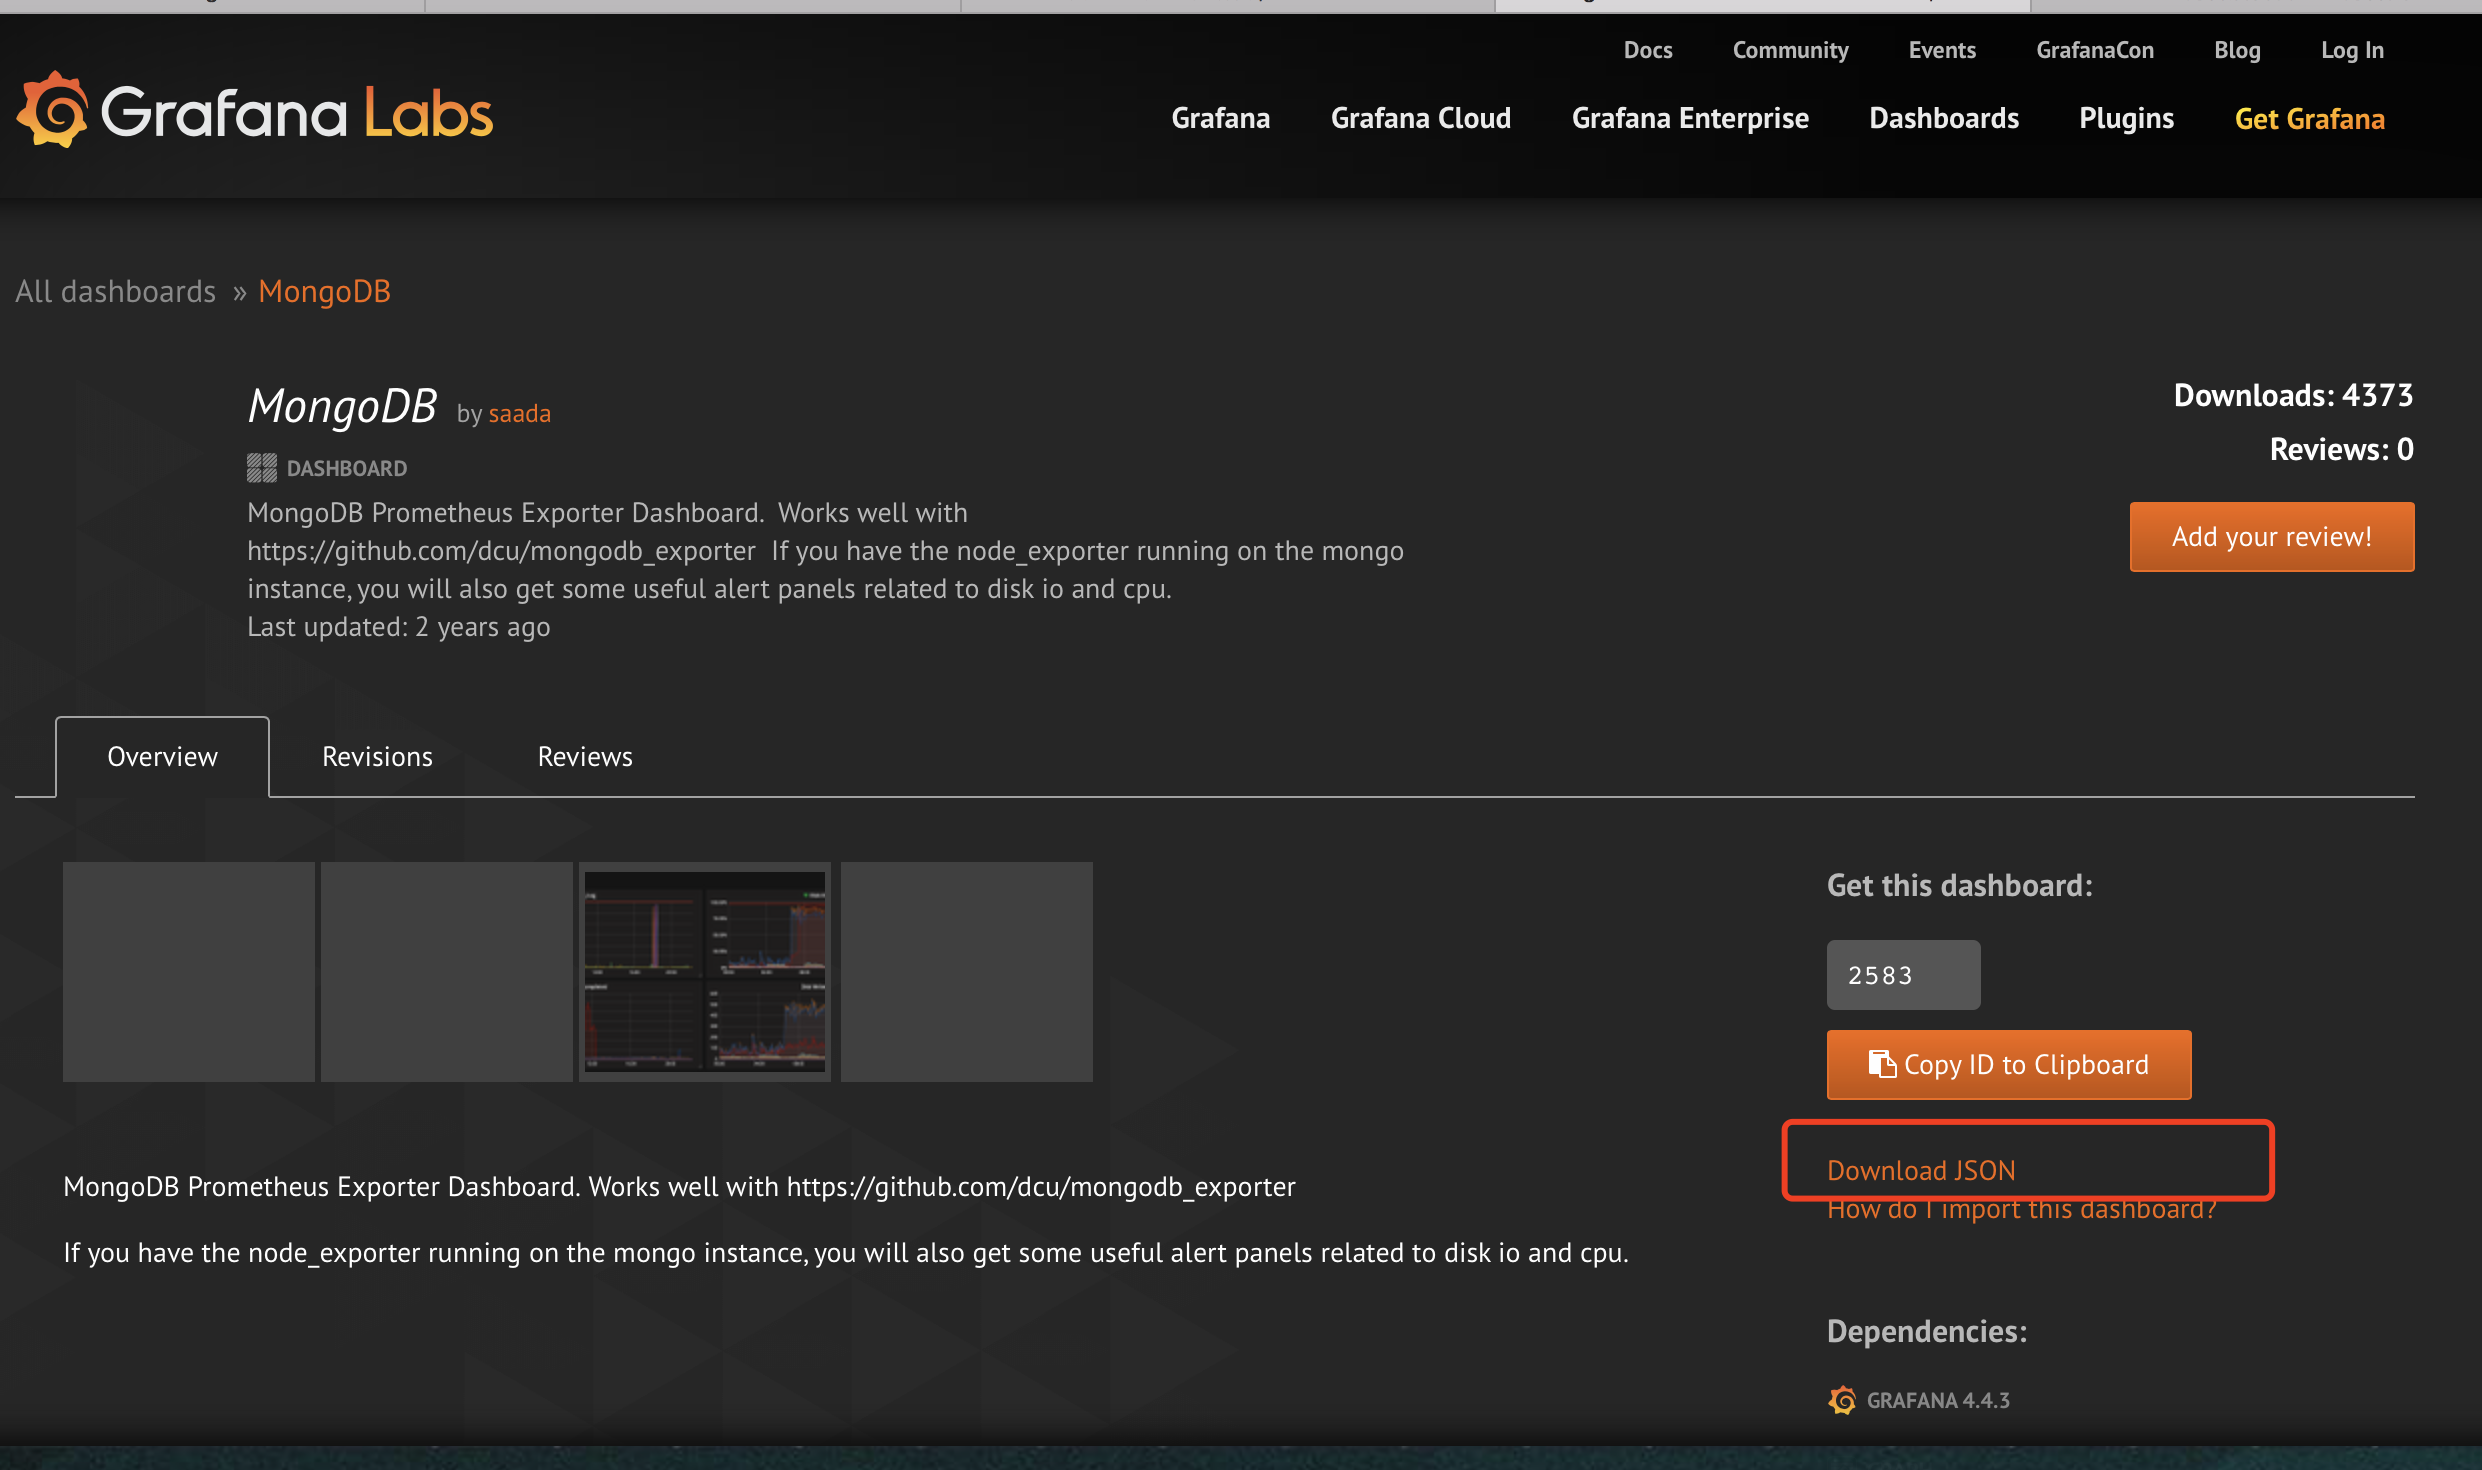
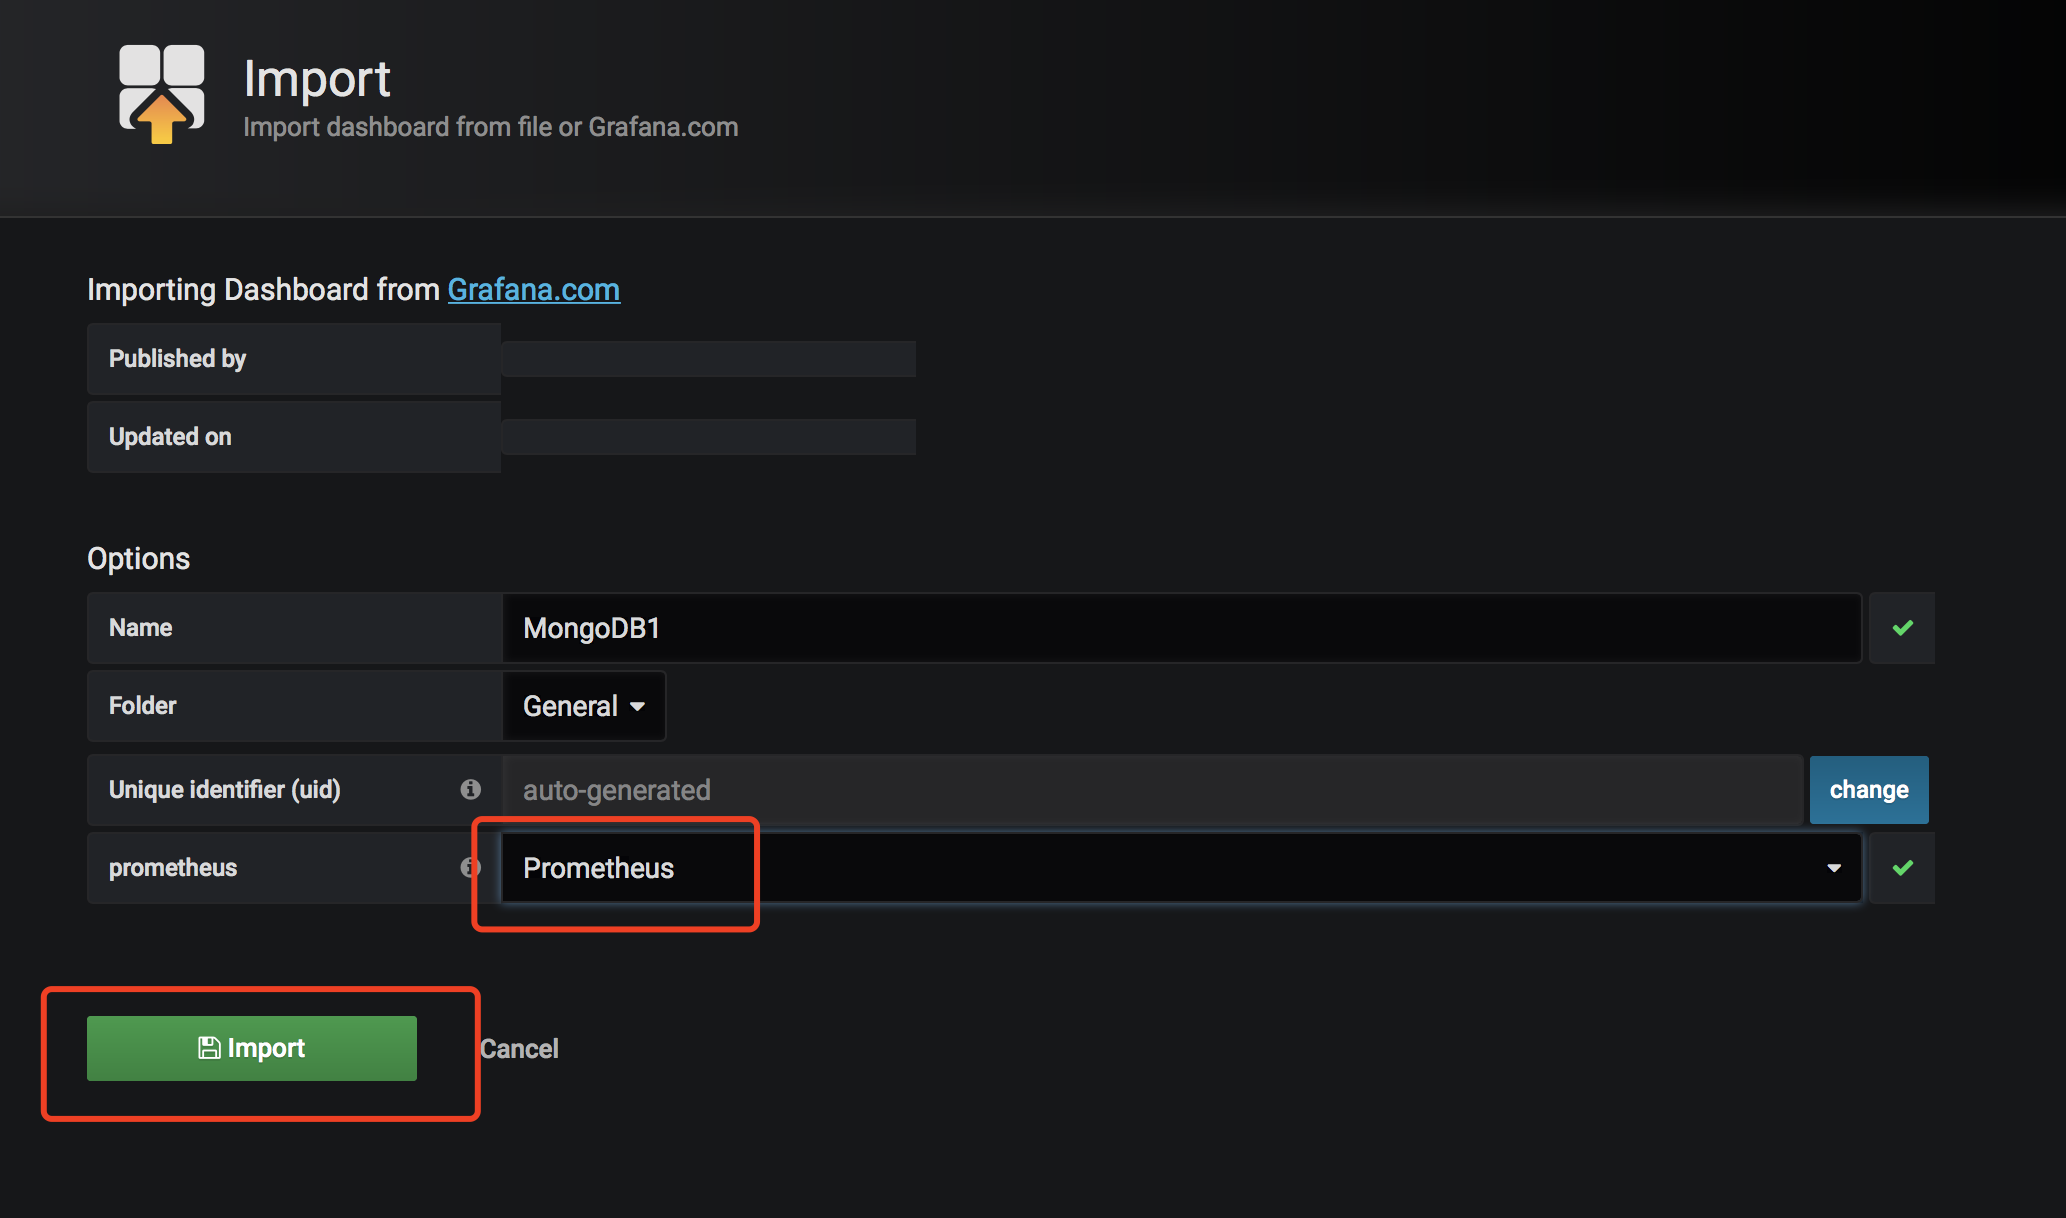
import一个已经做好的表盘:打开https://grafana.com/dashboards/2583,downloadjson
import此表盘

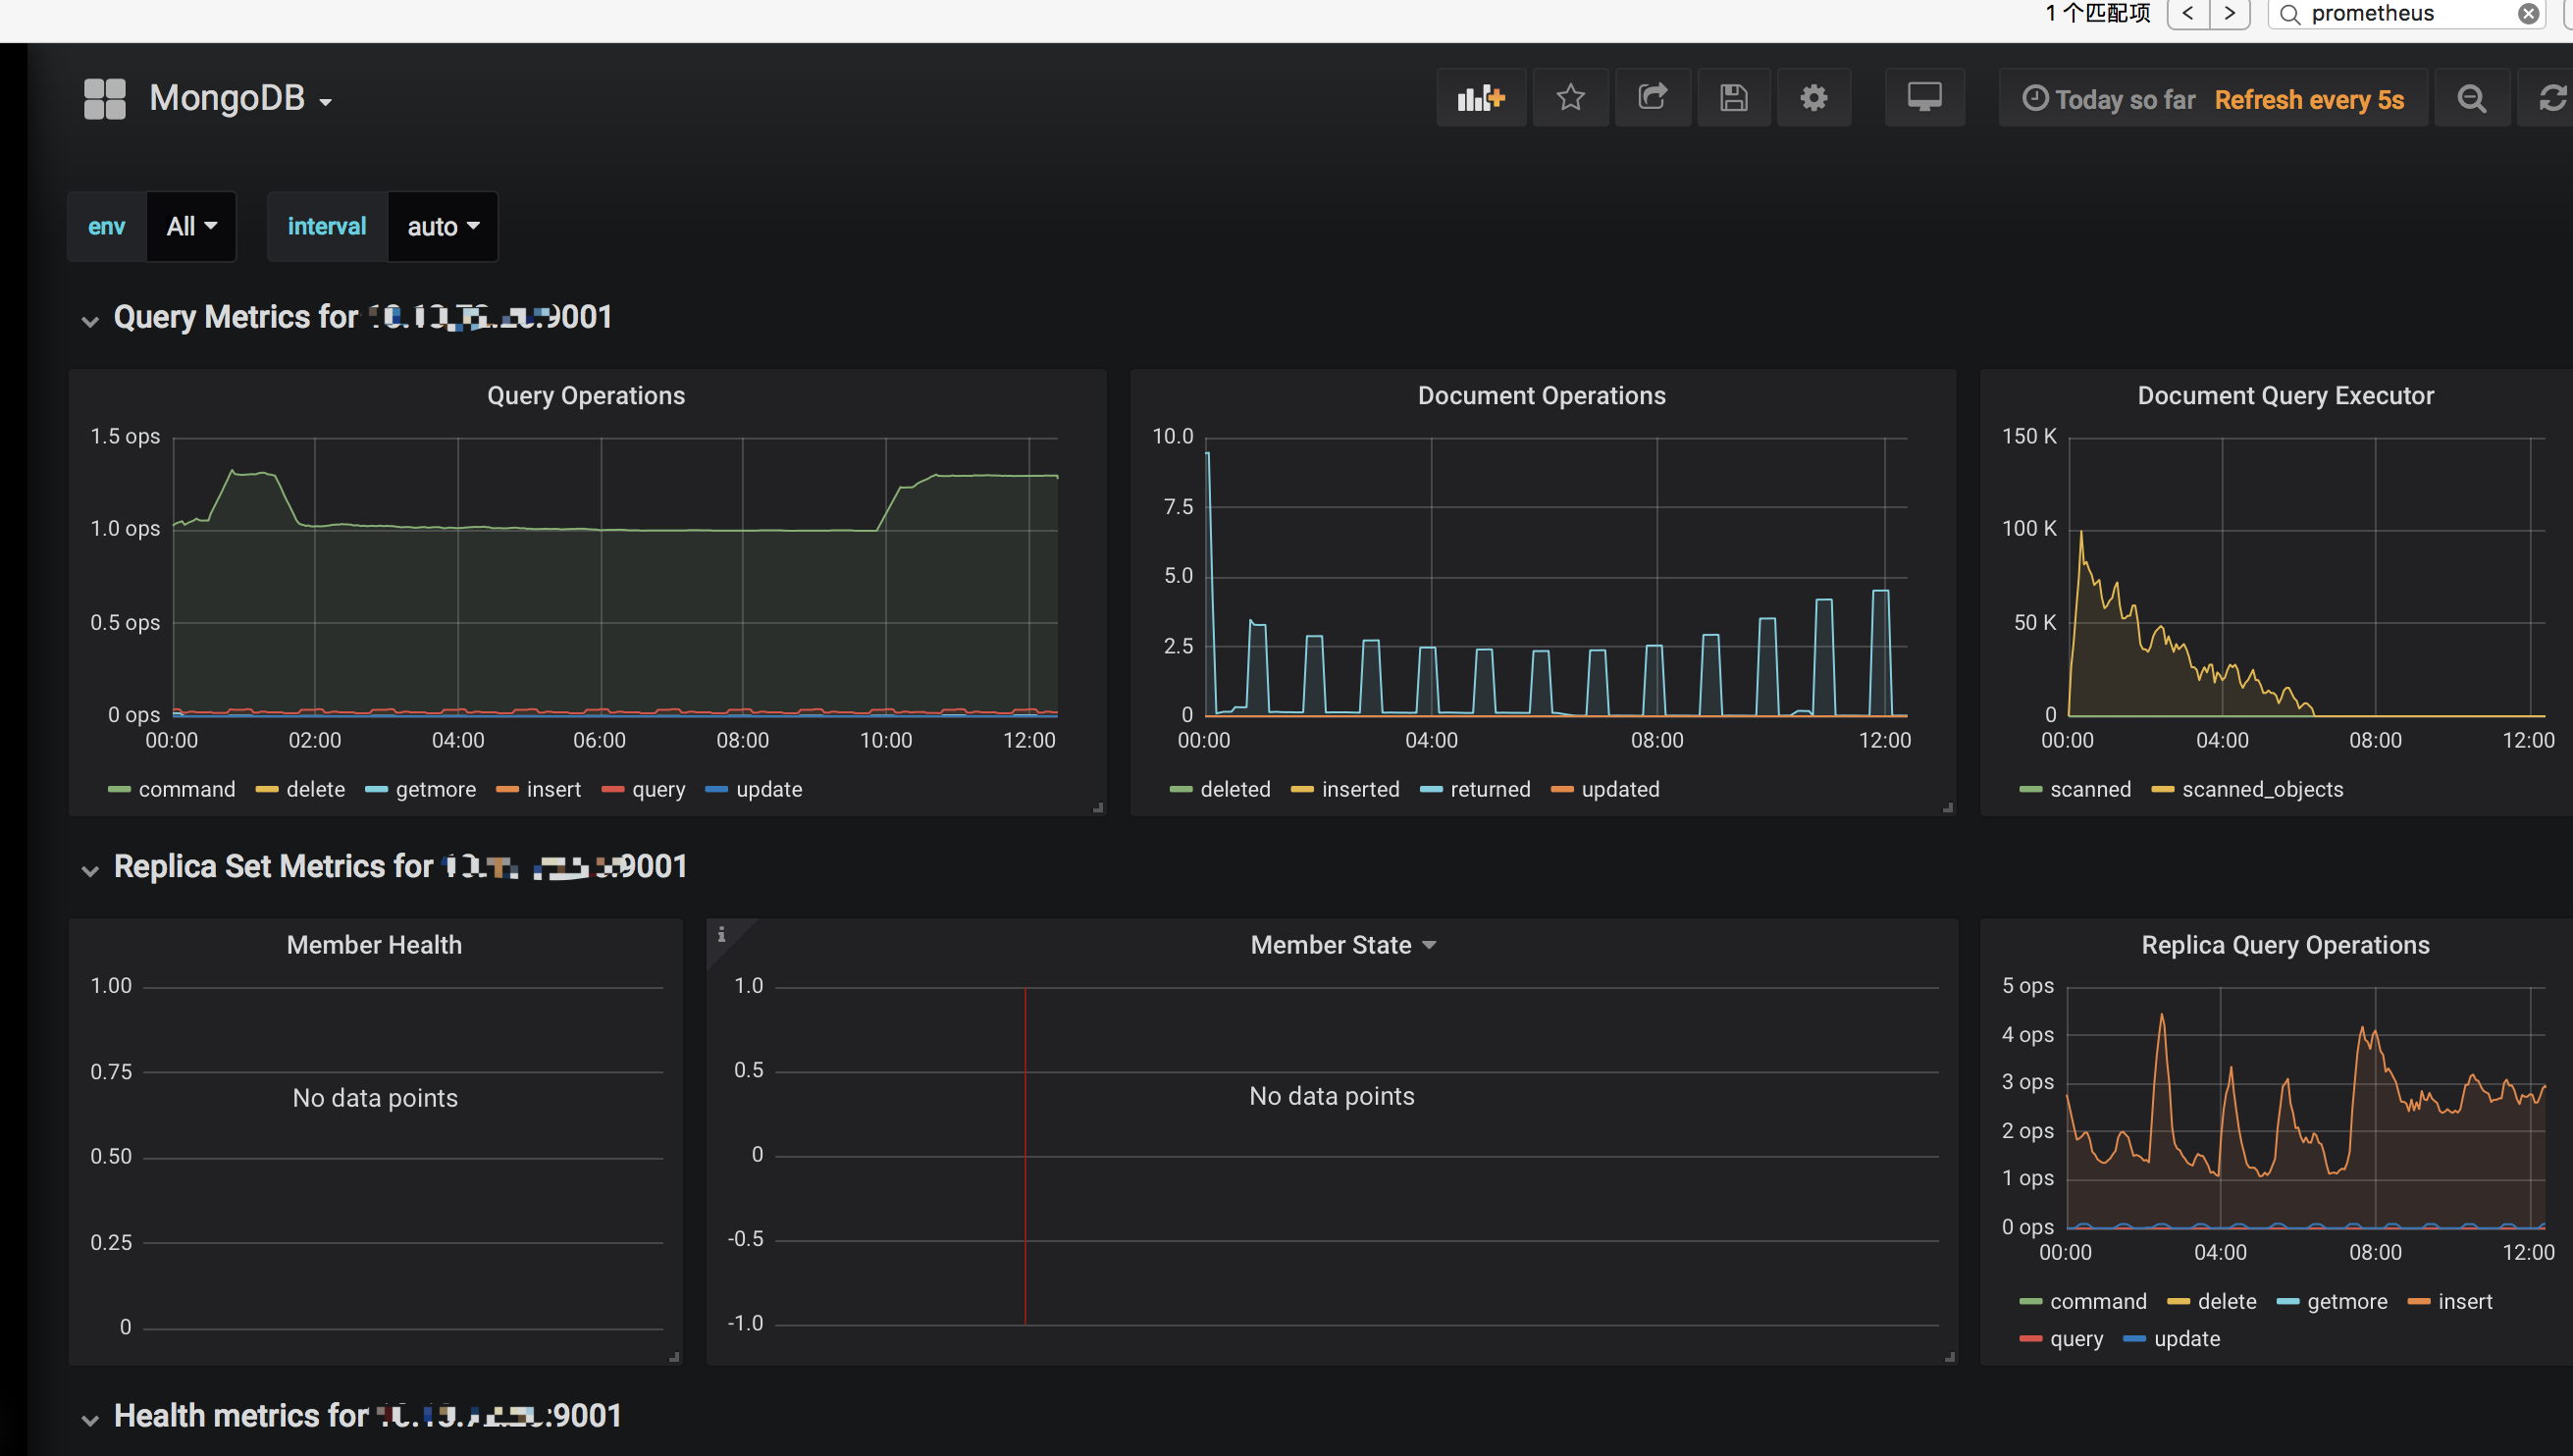
效果图