听说python语言在编程界排名又升了,其热度堪比此时七月天的气温,烫人。
Python不仅在Web,数据分析和AI(人工智能)领域大展身手,而且在MAP方面,也是独领风骚。
比如像下面这些炫图:


Python分分钟钟搞定。
先以曲线图为例:
第一步:首先安装必需的包:
Matplotlib,numpy
例如:
1、终端命令:pip install matplotlib
2、当然IDE中也可以直接安装
第二步:设置基本的曲线数据
from mpl_toolkits.mplot3d import axes3d
import matplotlib.pyplot as plt
from matplotlib import cm

fig = plt.figure()
ax = fig.gca(projection='3d')
X, Y, Z = axes3d.get_test_data(0.05)

cset = ax.contour(X, Y, Z, extend3d=True, cmap=cm.coolwarm)

ax.clabel(cset, fontsize=9, inline=1)

plt.show()
第三步:运行代码,就可以生成图: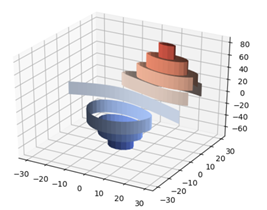
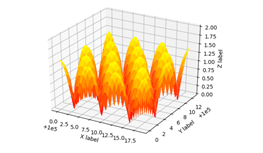
使用python还可以生成更酷的三维图:
代码如下:
from mpl_toolkits.mplot3d import Axes3D  # noqa: F401 unused import

import matplotlib.pyplot as plt
import numpy as np


fig = plt.figure()
ax = fig.gca(projection='3d')

X, Y = np.mgrid[0:6*np.pi:0.25, 0:4*np.pi:0.25]
Z = np.sqrt(np.abs(np.cos(X) + np.cos(Y)))
ax.plot_surface(X + 1e5, Y + 1e5, Z, cmap='autumn', cstride=2, rstride=2)
ax.set_xlabel("X label")
ax.set_ylabel("Y label")
ax.set_zlabel("Z label")
ax.set_zlim(0, 2)
plt.show()

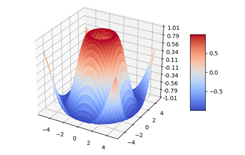
import numpy as np
import matplotlib.pyplot as plt
from mpl_toolkits.mplot3d import Axes3D
from matplotlib import cm
from matplotlib.ticker import LinearLocator, FormatStrFormatter
fig = plt.figure(figsize=(16,12))
ax = fig.gca(projection="3d")
#准备数据
x = np.arange(-5, 5, 0.25) #生成[-5,5]间隔0.25的数列,间隔越小,曲面越平滑
y = np.arange(-5, 5, 0.25)
x, y = np.meshgrid(x,y) #格点矩阵,原来的x行向量向下复制len(y)次,形成len(y)*len(x)的矩阵,即为新的x矩阵;原来的y列向量向右复制len(x)次,形成len(y)*len(x)的矩阵,即为新的y矩阵;新的x矩阵和新的y矩阵shape相同
r = np.sqrt(x ** 2 + y ** 2)
z = np.sin(r)
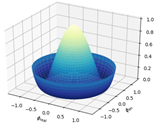
surf = ax.plot_surface(x, y, z, cmap=cm.coolwarm) # cmap指color map
#自定义z轴
ax.set_zlim(-1, 1)
ax.zaxis.set_major_locator(LinearLocator(20)) # z轴网格线的疏密,刻度的疏密,20表示刻度的个数
ax.zaxis.set_major_formatter(FormatStrFormatter('%.02f')) # 将z的value字符串转为float,保留2位小数
#设置坐标轴的label和标题
ax.set_xlabel('x',size=15)
ax.set_ylabel('y',size=15)
ax.set_zlabel('z',size=15)
ax.set_title("Surface plot", weight='bold', size=20)
#添加右侧的色卡条
fig.colorbar(surf, shrink=0.6, aspect=8) # shrink表示整体收缩比例,aspect仅对bar的宽度有影响,aspect值越大,bar越窄
plt.show()

import numpy as np
import matplotlib.pyplot as plt
import matplotlib.tri as mtri
#This import registers the 3D projection, but is otherwise unused.
from mpl_toolkits.mplot3d import Axes3D # noqa: F401 unused import
fig = plt.figure(figsize=plt.figaspect(0.5))
#============
#First plot
#============
#Make a mesh in the space of parameterisation variables u and v
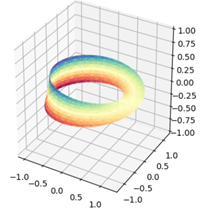
u = np.linspace(0, 2.0 * np.pi, endpoint=True, num=50)
v = np.linspace(-0.5, 0.5, endpoint=True, num=10)
u, v = np.meshgrid(u, v)
u, v = u.flatten(), v.flatten()
#This is the Mobius mapping, taking a u, v pair and returning an x, y, z
#triple
x = (1 + 0.5 * v * np.cos(u / 2.0)) * np.cos(u)
y = (1 + 0.5 * v * np.cos(u / 2.0)) * np.sin(u)
z = 0.5 * v * np.sin(u / 2.0)
#Triangulate parameter space to determine the triangles
tri = mtri.Triangulation(u, v)
#Plot the surface. The triangles in parameter space determine which x, y, z
#points are connected by an edge.
ax = fig.add_subplot(1, 2, 1, projection='3d')
ax.plot_trisurf(x, y, z, triangles=tri.triangles, cmap=plt.cm.Spectral)
ax.set_zlim(-1, 1)
#============
#Second plot
#============
#Make parameter spaces radii and angles.
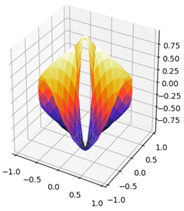
n_angles = 36
n_radii = 8
min_radius = 0.25
radii = np.linspace(min_radius, 0.95, n_radii)
angles = np.linspace(0, 2*np.pi, n_angles, endpoint=False)
angles = np.repeat(angles[..., np.newaxis], n_radii, axis=1)
angles[:, 1::2] += np.pi/n_angles
#Map radius, angle pairs to x, y, z points.
x = (radii*np.cos(angles)).flatten()
y = (radii*np.sin(angles)).flatten()
z = (np.cos(radii)*np.cos(3*angles)).flatten()
#Create the Triangulation; no triangles so Delaunay triangulation created.
triang = mtri.Triangulation(x, y)
#Mask off unwanted triangles.
xmid = x[triang.triangles].mean(axis=1)
ymid = y[triang.triangles].mean(axis=1)
mask = xmid**2 + ymid**2 < min_radius**2
triang.set_mask(mask)
#Plot the surface.
ax = fig.add_subplot(1, 2, 2, projection='3d')
ax.plot_trisurf(triang, z, cmap=plt.cm.CMRmap)
plt.show()
同样,还可以生成这些:
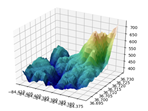

有兴趣的伙伴,可以试着操作下,若需要源码,可以联系我们。