python中tkinter的Canvas绘图不显示的解决方法
1、如下为绘图不成功的代码
from tkinter import *
import math

WIDTH, HEIGHT = 510, 210
ORIGIN_X, ORIGIN_Y = 2, HEIGHT/2 #原点

SCALE_X, SCALE_Y = 40, 100 #x轴、y轴缩放倍数
ox, oy = 0, 0
x, y = 0, 0
arc = 0 #弧度
END_ARC = 360 * 2 #函数图形画两个周期

root = Tk()
c = Canvas(root, bg = 'white', width = WIDTH, height = HEIGHT)
c.pack()

c.create_text(200, 20, text = 'y = cos(x)')
c.create_line(0, ORIGIN_Y, WIDTH, ORIGIN_Y)
c.create_line(ORIGIN_X, 0, ORIGIN_X, HEIGHT)
for i in range(0, END_ARC+1, 10):
    arc = math.pi * i / 180
    x = ORIGIN_X + arc * SCALE_X
    y = ORIGIN_Y - math.cos(arc) * SCALE_Y
    c.create_line(ox, oy, x, y)
    ox, oy = x, y
直接执行返回 0 然后没有显示图片
2、解决办法
在最下面加一行代码:
root.mainloop()
完整代码如下:
from tkinter import *
import math
WIDTH, HEIGHT = 510, 210
ORIGIN_X, ORIGIN_Y = 2, HEIGHT/2 #原点
SCALE_X, SCALE_Y = 40, 100 #x轴、y轴缩放倍数
ox, oy = 0, 0
x, y = 0, 0
arc = 0 #弧度
END_ARC = 360 * 2 #函数图形画两个周期
root = Tk()
c = Canvas(root, bg = 'white', width = WIDTH, height = HEIGHT)
c.pack()
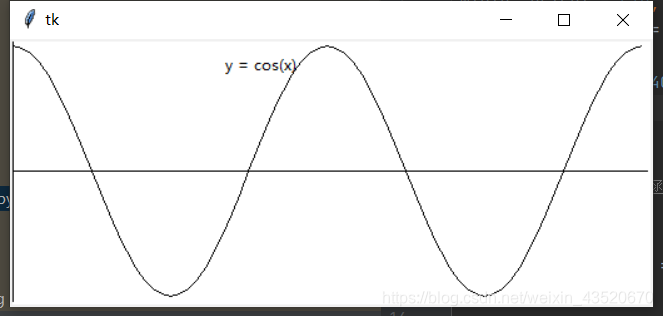
c.create_text(200, 20, text = 'y = cos(x)')
c.create_line(0, ORIGIN_Y, WIDTH, ORIGIN_Y)
c.create_line(ORIGIN_X, 0, ORIGIN_X, HEIGHT)
for i in range(0, END_ARC+1, 10):
arc = math.pi * i / 180
x = ORIGIN_X + arc * SCALE_X
y = ORIGIN_Y - math.cos(arc) * SCALE_Y
c.create_line(ox, oy, x, y)
ox, oy = x, y
root.mainloop()
然后即可绘制出图片
3、原因
root到root.pack()之间,是设计的部件的类型,尺寸,样式,位置,然后绑定一个事件。mainloop就进入到事件(消息)循环。一旦检测到事件,就刷新组件。那是网上的说法,我的理解是如果没有mainloop,它也会绘图,但是绘图完成后就关闭了程序,所以就好像没有显示一样,加上mainloop后,它会监听你的行为,有关闭它才会结束程序。如果有大佬知道更好的的答案,欢迎评论区留言。