简介
有时候在绘制colorbar时,当设置了数据的取值范围后,超出范围两端的表示方法有时候需要增加尖角进行描述。而Matlab自带colorbar函数并没有该功能。可以通过增加功能函数使得colorbar增加尖角。
方法1
代码源自Matlab论坛:https://www.mathworks.com/matlabcentral/fileexchange/52515-cbarrow-pointy-ends-for-colorbars
函数代码
function h = cbarrow(options)
%% cbarrow documentation
% The cbarrow function places triangle-shaped endmembers on colorbars to
% indicate that data values exist beyond the extents of the values shown in
% the colorbar.
%
% This function works by creating a set of axes atop the current figure and
% placing patch objects on the new axes.  Thus, editing a figure after
% calling cbarrow may cause some glitches.  Therefore, it is recommended to call
% cbarrow last when creating plots.
%
%% Syntax
%
%  cbarrow
%  cbarrow(Direction)
%  cbarrow('delete')
%  h = cbarrow(...)
%
%% Description
%
% cbarrow places triangle-shaped endmembers on both ends of the current
% colorbar.
%
% cbarrow(Direction) specifies a single direction to place a colorbar end
% arrow.  Direction can be 'up', 'down', 'right', or 'left'.
%
% cbarrow('delete') deletes previously-created cbarrow objects.
%
% h = cbarrow(...) returns a handle of the axes on which cbarrow
% objects are created.
%
%% Example 1: Both directions
%
% surf(peaks)
% axis tight
% colorbar
% caxis([0 3])
% cbarrow
%
%% Example 2: One direction
%
% surf(peaks)
% axis tight
% colorbar('southoutside')
% colormap(brewermap(256,'*RdBu'))
% caxis([-7 7])
% cbarrow('right')
%
%% Known issues
% This function only works once per figure.  If you have multiple subplots,
% you can only use it once, and you'll have to call cbarrow last.  Also,
% editing plots after calling cbarrow can sometimes be a bit glitchy.
%
%% Author Info
% The newcolorbar function was written by Chad A. Greene of the
% University of Texas at Austin's Institute for Geophysics (UTIG), August 2015.
% Updated June 2016 to fix a bug in cbarrow('down'), thanks to Aodat for pointing this out.
% http://www.chadagreene.com.
%
% See also caxis and colorbar.
%% Error checks:
assert(verLessThan('matlab','8.4.0')==0,'Sorry, the cbarrow function requires Matlab R2014b or later.')
narginchk(0,1)
%% Guess which arrows to create based on current colorbar orientation:
% Find handles of all colorbars in current figure:
hcb = findobj(gcf,'Type','Colorbar');
% If no colorbars exist in current figure, create a new one:
if isempty(hcb)
    cb = colorbar;
else
    % Otherwise, use the most recent colorbar in the list:
    cb = hcb(1);
end

cbpos = cb.Position;
ax1 = gca;
ax1pos = get(ax1,'OuterPosition');
% If the colorbar is wider than it is tall, make left and right arrows:
if cbpos(4)<cbpos(3)
    makerightarrow = true;
    makeleftarrow = true;
    makeuparrow = false;
    makedownarrow = false;
else
    % Otherwise make up and down arrows:
    makerightarrow = false;
    makeleftarrow = false;
    makeuparrow = true;
    makedownarrow = true;
end
%% Override automatic arrow selection if user requested a specific arrow:
if nargin>0
    switch lower(options)
        case {

    'del','delete'}
            try
                h_cbarrow = findobj(gcf,'tag','cbarrow');
                delete(h_cbarrow);
            end
            return

        case {

    'r','right'}
            makerightarrow = true;
            makeleftarrow = false;

        case {

    'l','left'}
            makeleftarrow = true;
            makerightarrow = false;

        case {

    'u','up'}
            makeuparrow = true;
            makedownarrow = false;

        case {

    'd','down'}
            makedownarrow = true;
            makeuparrow = false;

        otherwise
            error('Invalid input in cbarrow. Must be ''up'',''down'', ''left'', ''right'', ''delete'', or no inputs at all for automatic cbarrowing.')
    end
end
%% Shrink position of the colorbar to allow room for arrows:
if makerightarrow
    cbpos = cbpos + [0 0 -cbpos(4)*sqrt(2)/2 0];
    cb.Position = cbpos;
end
if makeleftarrow
    cbpos = cbpos + [cbpos(4)*sqrt(2)/2 0 -cbpos(4)*sqrt(2)/2 0];
    cb.Position = cbpos;
end
if makeuparrow
    cbpos = cbpos + [0 0 0 -cbpos(3)*sqrt(2)/2];
    cb.Position = cbpos;
end
if makedownarrow
    cbpos = cbpos + [0 cbpos(3)*sqrt(2)/2 0 -cbpos(3)*sqrt(2)/2];
    cb.Position = cbpos;
end
%% Create triangle arrows as patch objects in new axes:
% Get colormap so we know what color to make the triangles:
cm = colormap;
% Create background axes on which to plot patch objects:
h = axes('position',[0 0 1 1],'tag','cbarrow');
hold on
% Plot arrows:
if makerightarrow
    rightarrowx = (cbpos(1)+cbpos(3)) + [0 cbpos(4)*sqrt(2)/2 0 0];
    rightarrowy = cbpos(2) + [0 cbpos(4)/2 cbpos(4) 0];
    hr = patch(rightarrowx,rightarrowy,cm(end,:),'EdgeColor',cm(end,:));
end
if makeleftarrow
    leftarrowx = cbpos(1) + [0 -cbpos(4)*sqrt(2)/2 0 0];
    leftarrowy = cbpos(2) + [0 cbpos(4)/2 cbpos(4) 0];
    hl = patch(leftarrowx,leftarrowy,cm(1,:),'EdgeColor',cm(1,:));
end
if makeuparrow
    uparrowx = cbpos(1) + [0 cbpos(3) cbpos(3)/2 0];
    uparrowy = cbpos(2)+cbpos(4) + [0 0 cbpos(3)*sqrt(2)/2 0];
    hu = patch(uparrowx,uparrowy,cm(end,:),'EdgeColor',cm(end,:));
end
if makedownarrow
    downarrowx = cbpos(1) + [0 cbpos(3) cbpos(3)/2 0];
    downarrowy = cbpos(2) + [0 0 -cbpos(3)*sqrt(2)/2 0];
    hd = patch(downarrowx,downarrowy,cm(1,:),'EdgeColor',cm(1,:));
end
%% Change edge colors:
if strcmpi(cb.Box,'on')

    % Get starting color and linewidth of colorbar box:
    linecolor = cb.Color;
    linewidth = cb.LineWidth;

    % Turn off colorbar box and we'll create a new one:
    cb.Box = 'off';

    % Edge line for left and right arrows:
    if all([makerightarrow makeleftarrow])
        line(cbpos(1) +[0 cbpos(3) cbpos(3)+cbpos(4)*sqrt(2)/2 cbpos(3) 0 -cbpos(4)*sqrt(2)/2 0],...
            cbpos(2) + [0 0 cbpos(4)/2 cbpos(4) cbpos(4) cbpos(4)/2 0],...
            'color',linecolor,'LineWidth',linewidth)
    end

    % Edge line for right only:
    if all([makerightarrow ~makeleftarrow])
        line(cbpos(1) +[0 cbpos(3) cbpos(3)+cbpos(4)*sqrt(2)/2 cbpos(3) 0 0],...
            cbpos(2) + [0 0 cbpos(4)/2 cbpos(4) cbpos(4) 0],...
            'color',linecolor,'LineWidth',linewidth)
    end

    % Edge line for left arrow only:
    if all([~makerightarrow makeleftarrow])
        line(cbpos(1) +[0 cbpos(3) cbpos(3) 0 -cbpos(4)*sqrt(2)/2 0],...
            cbpos(2) + [0 0 cbpos(4) cbpos(4) cbpos(4)/2 0],...
            'color',linecolor,'LineWidth',linewidth)
    end

    % Edge line for up and down arrows:
    if all([makeuparrow makedownarrow])
        line(cbpos(1) +[0 0 cbpos(3)/2 cbpos(3) cbpos(3) cbpos(3)/2 0],...
            cbpos(2) + [0 cbpos(4) cbpos(4)+cbpos(3)*sqrt(2)/2 cbpos(4) 0 -cbpos(3)*sqrt(2)/2 0],...
            'color',linecolor,'LineWidth',linewidth)
    end

    % Edge line for up arrow only:
    if all([makeuparrow ~makedownarrow])
        line(cbpos(1) +[0 0 cbpos(3)/2 cbpos(3) cbpos(3) 0],...
            cbpos(2) + [0 cbpos(4) cbpos(4)+cbpos(3)*sqrt(2)/2 cbpos(4) 0 0],...
            'color',linecolor,'LineWidth',linewidth)
    end

    % Edge line for down arrow only:
    if all([~makeuparrow makedownarrow])
        line(cbpos(1) +[0 0 cbpos(3) cbpos(3) cbpos(3)/2 0],...
            cbpos(2) + [0 cbpos(4) cbpos(4) 0 -cbpos(3)*sqrt(2)/2 0],...
            'color',linecolor,'LineWidth',linewidth)
    end
end
%% Clean up:
axis off
axis([0 1 0 1])
% If original current axes were resized, unresize them:
set(ax1,'OuterPosition',ax1pos)
switch lower(cb.Location)
    case {

    'south','east','north','west'}
        % Bring our arrow patch object axes to the front if the colorbar is inside the current axes:
        axes(h)
    otherwise
        % Bring user's data axes to the front:
        axes(ax1)
end
% Delete output if user did not request it:
if nargout==0
    clear h
end
end
用法
surf(peaks)
axis tight
colorbar
caxis([0 3])
cbarrow
效果

方法2
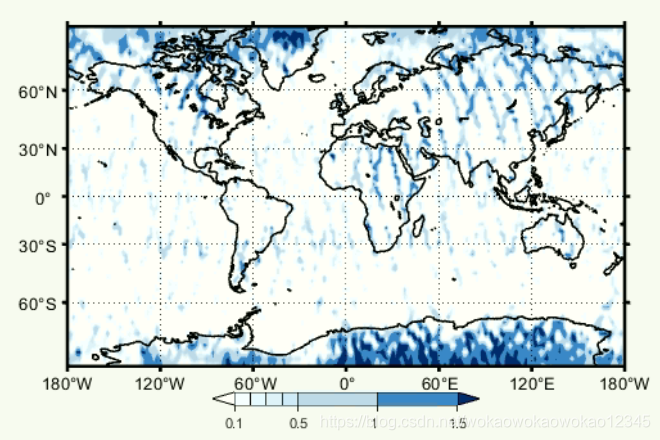
需要安装m_map工具箱。该方法需要设置colorbar的位置,这一点不是很好把握,但是做出来的colorbar效果还是很不错的,还可以设置非线性标签。图列中的数据需要自行准备。
代码
clf;
m_proj('miller','lat',82);
m_pcolor(m_lon,m_lat,m_sps);
[CS,CH]=m_contourf(m_lon,m_lat,m_sps,[0.1:0.1:0.5 1:0.5:1.5],'edgecolor','none');

m_coast('color',[0 0 0], 'linewidth', 1.2);
m_grid('tickdir','out','linewi',2);

ax = m_contfbar([.3 .7],.05,CS,CH);

% 如果bar是竖直的,这里是ytick和yticklabel
ax.XTick = [0.1 0.5 1:0.5:1.5];
ax.XTickLabel = [0.1 0.5 1:0.5:1.5];
colormap(flipud(m_colmap('Blues')))
% close all;