wrk基准测试技能介绍
wrk简介
wrk 是一个开源的支持HTTP协议的基准测试工具,它的特点是高并发低损耗,安装部署简单,但是,不适合做多协议及复杂场景的性能测试。它原生支持LuaJIT脚本
wrk安装
linux系统中,首先需要安装git,因为代码开源在github上,运行依赖gcc、openssl
# 下载
git clone https://github.com/wg/wrk.git

# 编译
cd wrk  # 进入下载后的文件路径
make
wrk使用说明
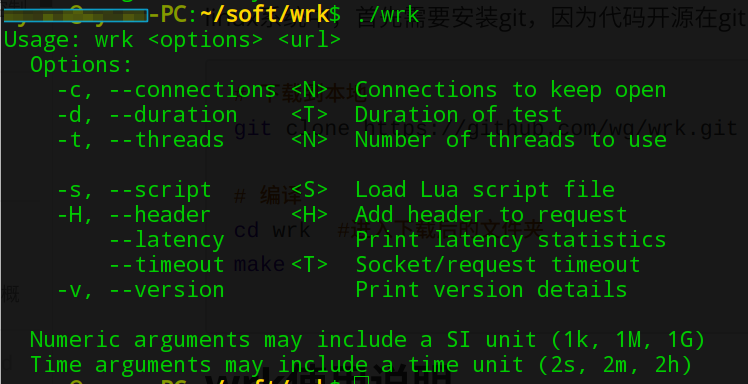
Usage: wrk <options> <url>
  Options:
    -c, --connections <N>  Connections to keep open
    -d, --duration    <T>  Duration of test
    -t, --threads     <N>  Number of threads to use

    -s, --script      <S>  Load Lua script file
    -H, --header      <H>  Add header to request
        --latency          Print latency statistics
        --timeout     <T>  Socket/request timeout
    -v, --version          Print version details

  Numeric arguments may include a SI unit (1k, 1M, 1G)
  Time arguments may include a time unit (2s, 2m, 2h)
-c, 后面跟数字,代表http连接数
-d, 后面跟数字,代表持续运行时长
-t, 后面跟数字,代表启动多少个线程
-s, 后面跟脚本名称,脚本用lua编写
-H, 后面跟消息头
--latency 代表输出响应的详细信息
--timeout 后面跟设置的超时时长
-v, 版本信息
演示示例
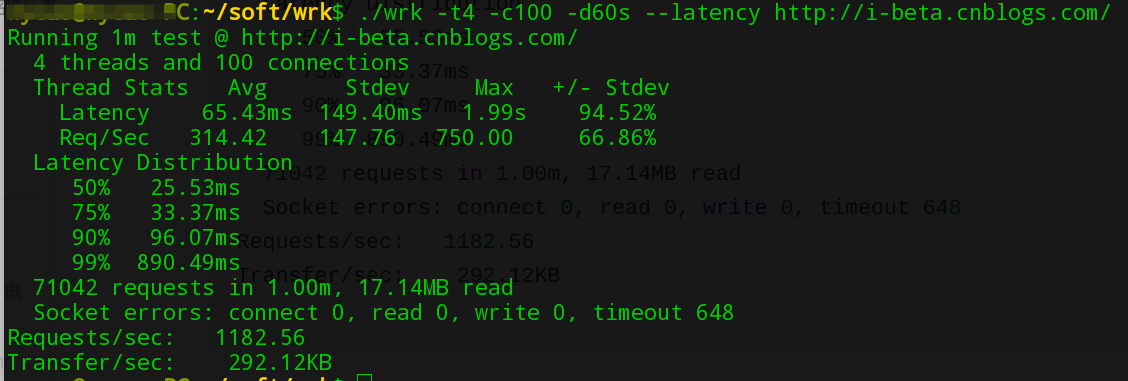
wy@wy-PC:~/soft/wrk$ ./wrk -t4 -c100 -d60s --latency http://i-beta.cnblogs.com/
Running 1m test @ http://i-beta.cnblogs.com/
  4 threads and 100 connections
  Thread Stats   Avg      Stdev     Max   +/- Stdev
    Latency    65.43ms  149.40ms   1.99s    94.52%
    Req/Sec   314.42    147.76   750.00     66.86%
  Latency Distribution
     50%   25.53ms
     75%   33.37ms
     90%   96.07ms
     99%  890.49ms
  71042 requests in 1.00m, 17.14MB read
  Socket errors: connect 0, read 0, write 0, timeout 648
Requests/sec:   1182.56
Transfer/sec:    292.12KB
命令:./wrk -t4 -c100 -d60s --latency 网址
-t4: 4个线程
-c100: 建立100个连接
-d60s: 持续运行60s
-- Latency: 显示详细响应信息
Running 1m test @
http://i-beta.cnblogs.com/: 向某个网址持续施压 1 分钟
4 threads and 100 connections:4个线程,共建立100个连接
Thread Stats   Avg      Stdev     Max   +/- Stdev
    Latency    65.43ms  149.40ms   1.99s    94.52%
    Req/Sec   314.42    147.76   750.00     66.86%
简易的聚合报告,显示 平均响值、标准方差、最大值、偏差振幅(值越大,说明离散程度越高)
Latency:响应时间分布
Req/Sec:每秒请求数
Latency Distribution
   50%   25.53ms
   75%   33.37ms
   90%   96.07ms
   99%  890.49ms
50% 75% 90% 99%的响应时间分布图表
71042 requests in 1.00m, 17.14MB read: 在 1 分钟内,共请求了71042次,读取了17.14MB数据
Socket errors: connect 0, read 0, write 0, timeout 648:本次测试,连接错误 0 次, 读取错误 0 次, 写错误 0 次, 超时错误 648 次
Requests/sec: 1182.56: 本次测试,所有线程平均每秒 1182.56 次请求
Transfer/sec: 292.12KB: 本次测试, 所有请求的平均吞吐量为 292.12KB
推荐一个软件测试学习交流群:785128166,群里有分享的视频,面试指导,测试资料,还有思维导图、群里有视频,都是干货的,你可以下载来看。主要分享测试基础、接口测试、性能测试、自动化测试、TestOps架构、Jmeter、LoadRunner、Fiddler、MySql、Linux、简历优化、面试技巧以及大型测试项目实战视频资料。合理利用自己每一分每一秒的时间来学习提升自己,不要再用"没有时间“来掩饰自己思想上的懒惰!趁年轻,使劲拼,给未来的自己一个交代!
公众号:程序员二黑, 关注后免费领取海量学习资料。
好东西要和朋友一起分享哦