echarts的配置
option = {
//标题
title: {
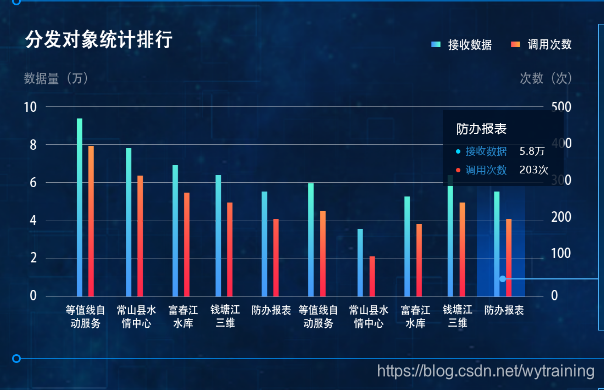
text: '分发对象统计排行',
textStyle: {
color: '#ffffff',
fontSize: 36,
fontWeight:'bold',
}
},
//生成的图片和顶部的间距
grid: {
top: 100,
left: 20,
right: 20,
containLabel: true//为ture才会生效
},
//图例
legend: {
data: ['接收数据', '调用次数'],
left: 'center',
itemWidth: 18, //图例宽高
itemHeight: 10,
textStyle: {//图例文字的样式
color: '#ffffff',
fontSize: 22,
lineHeight: 15,
rich: {
a: {
color: '#6e828d',
padding: [0, 0, 0, 5],
width: 70,
},
b: {
color: '#6e828d',
width: 55,
}
}
},
formatter: function(name: any){
//name: 行业1@5,有多个信息
if(name) {
let val1 = name.split("@")[0];
let val2 = name.split("@")[1] + '%';
return '{a|'+ val1 + '}' + '{b|'+ val2 + '}'
}
}
},
//提示框
tooltip : {
appendToBody: true, //解决提示框被遮挡问题(appendToBody默认为false)
trigger: 'axis',
padding: [10],
backgroundColor:'rgba(102,102,102,0.8)', //提示框背景色
textStyle: {
color: '#feffff', //提示框文字
fontSize: 16
},
// formatter: function (params) {
// console.log(params);
// return params[0].name //自定义提示框内容
// },
axisPointer : { // 坐标轴指示器,坐标轴触发有效
type : 'shadow', // 默认为直线,可选为:'line' | 'shadow'
//鼠标悬浮柱状的背景色
shadowStyle: {
color: {
type: 'linear',
x: 0,
y: 0,
x2: 0,
y2: 1,
colorStops: [{
offset: 0, color: 'rgba(0,106,255,0)' // 0% 处的颜色
}, {
offset: 1, color: 'rgba(0,106,255,0.5)' // 100% 处的颜色
}],
global: false // 缺省为 false
}
}
},
},
//x轴
xAxis: {
type: 'category',
data: ['等值线自助服务', '常山县水情中心', '富春江水库', '钱塘江三维', '钱塘江三维', '等值线自助服务', '常山县水情中心', '富春江水库', '钱塘江三维', '防办报表'],
axisLine: {
lineStyle: {
color: "rgba(255, 255, 255, 0.5)" //x轴
}
},
axisLabel: {
textStyle: {
fontSize: 20,
color: "rgba(255, 255, 255)" //x轴数据
},
interval: 0,
formatter: function(params) {
var newParamsName = ""; // 最终拼接成的字符串
var paramsNameNumber = params.length; // 实际标签的个数
var provideNumber = 4; // 每行能显示的字的个数
var rowNumber = Math.ceil(paramsNameNumber / provideNumber); // 换行的话,需要显示几行,向上取整
/**
* 判断标签的个数是否大于规定的个数, 如果大于,则进行换行处理 如果不大于,即等于或小于,就返回原标签
*/
// 条件等同于rowNumber>1
if (paramsNameNumber > provideNumber) {
/** 循环每一行,p表示行 */
for (var p = 0; p < rowNumber; p++) {
var tempStr = ""; // 表示每一次截取的字符串
var start = p * provideNumber; // 开始截取的位置
var end = start + provideNumber; // 结束截取的位置
// 此处特殊处理最后一行的索引值
if (p == rowNumber - 1) {
// 最后一次不换行
tempStr = params.substring(start, paramsNameNumber);
} else {
// 每一次拼接字符串并换行
tempStr = params.substring(start, end) + "\n";
}
newParamsName += tempStr; // 最终拼成的字符串
}
} else {
// 将旧标签的值赋给新标签
newParamsName = params;
}
//将最终的字符串返回
return newParamsName
}
},
},
//y轴
yAxis: [
{
type: 'value',
scale: true,
name: '接收数据',
nameTextStyle: {
fontSize: 24,
color: "rgba(255, 255, 255, 0.5)" //y轴 name
},
// max: 500,
min: 0,
boundaryGap: [0.2, 0.2],
axisLine: {show: false}, //是否显示y轴
axisTick: {show: false}, //y轴刻度
axisLabel: {
textStyle: {
fontSize: 24,
color: "rgba(255, 255, 255)"//y轴数据
},
formatter: '{value}K'
},
splitLine: {
lineStyle: {
color: "rgba(255, 255, 255, 0.25)" //横线样式
}
},
},
{
type: 'value',
scale: true,
name: '调用次数',
nameTextStyle: {
fontSize: 24,
color: "rgba(255, 255, 255, 0.5)" //y轴name
},
// max: 500,
min: 0,
boundaryGap: [0.2, 0.2],
axisLine: {show: false},
axisTick: {show: false},
axisLabel: {
textStyle: {
fontSize: 24,
color: "rgba(255, 255, 255)" //y轴数据
}
},
splitLine: {
lineStyle: {
color: "rgba(255, 255, 255, 0.25)" //横线样式
}
},
}
],
series: [
{
name: '接收数据',
type: 'bar',
data: [375, 424, 424, 452, 420, 124, 174, 425, 500, 190],
barWidth: 10,
barGap:'-500%',/*多个并排柱子设置柱子之间的间距*/
// barCategoryGap:'100%',/*多个并排柱子设置柱子之间的间距*/
label: {
normal: {
formatter: function (data) {
return data.data + "K"
},
show: true,
position: 'top',
fontSize: 16,
color: "#fff" //柱状数字标注
}
},
color: {
type: 'linear',
x: 0,
y: 0,
x2: 0,
y2: 1,
colorStops: [{
offset: 0, color: "#5bffd4"
}, {
offset: 1, color: '#4498fa'
}]
},
//阈值线
markLine: {
symbol: 'none',//去掉箭头
lineStyle: {
color: 'red',
type: 'solid'
},
data: [{
name: '阈值线',
yAxis: 10,
}]
},
},
{
name: '调用次数',
yAxisIndex: 1,
type: 'bar',
data: [412, 200, 150, 80, 325, 910, 130, 224, 255, 755],
barWidth: 10,
barGap:'100%',/*多个并排柱子设置柱子之间的间距*/
// barCategoryGap:'100',/*多个并排柱子设置柱子之间的间距*/
label: {
normal: {
show: true,
position: 'top',
fontSize: 16,
color: "#fff" //柱状数字标注
}
},
color: {
type: 'linear',
x: 0,
y: 0,
x2: 0,
y2: 1,
colorStops: [{
offset: 0, color: "#ffaa3b"
}, {
offset: 1, color: '#ff5858'
}]
},
}
]
}
效果图: