动态投影
所谓动态投影指,ArcMap中的Data 的空间参考或是说坐标系统是默认为第一加载到当前工作区的那个文件的坐标系统。如果后加入数据的坐标系统与当前工作区坐标系统不相同,则ArcMap会自动做投影变换,即把后加入数据投影变换到当前坐标系统下显示。然而,此时数据文件所存储的数据并没有改变,只是显示形态上的变化,因此叫动态投影。表现这一点最明显的例子就是,在Export Data时,会让你选择是按数据源的坐标系统导出,还是按照当前数据框架的坐标系统导出数据。
3、投影变换(ArcToolBox)
在ArcToolBox->Data Management Tools->Projections and Transformations工具集下有这么几个工具可以使用用:
1、Define Projection(定义一个Coordinate System)
2、Raster->Project Raster(对Raster进行投影变换)
3、Create Custom Geographic Transformation(定义一个地理变换方法)
方法一:
原理:当数据没有任何空间参考时,显示为Unknown!对于没有任何空间参考的数据,需要先利用Define Projection来给数据定义一个Coordinate System,然后在利用Feature->Project或Raster->Project Raster工具来对数据进行投影变换!由于我国经常使用的投影坐标系统为北京54,西安80!若变换前的坐标系统与变换后的坐标系统之间的Datum不一致,则需要提供一个Geographic Transformation。知道坐标系统转换参数后,可以利用Create Custom Geographic Transformation工具定义一个地理变换方法,变换方法可以根据3参数或7参数。
在Arcmap中转换:
1、加载要转换的数据,右下角为经纬度
2、右键单击Layers -> properties -> Coordinate System
3、导入或选择正确的坐标系,确定。这时右下角也显示坐标。但数据没改变
4、右击图层 -> Data -> “Export Data…”
5、在Export Raster Data窗口中,将spatial Reference选择为Data Frame (Current),输出路径,确定。
6、此方法类似于投影变换。
方法二:
在ArcToolbox中转换,具体步骤为:Data Management Tools -> Projections and Transformations -> Project,选择输入输出路径以及输出的坐标系。注意:原始数据必须要有投影。
Geographic Coordinate System
A geographic coordinate system uses the three-dimensional sphere surface to define locations on the earth, its import parameters are an angular unit of measure, a prime meridian and a datum (based on the revolutionary spheroid).
In the geographic coordinate system longitude and latitude are used to determine points on the sphere. Longitude and latitude are measured angles from the earth center to a point on the earth surface. In the spherical system, horizontal lines, or east–west lines, are lines of equal latitude, or parallels. Vertical lines, or north–south lines, are lines of equal longitude, or meridians. These lines encompass the globe and form a gridded network called a graticule.
The line of latitude midway between the poles is called the equator. It defines the line of zero latitude. The line of zero longitude is called the prime meridian. For most geographic coordinate systems, the prime meridian is the longitude that passes through Greenwich, England. Other countries use longitude lines that pass through Bern, Bogota, and Paris as prime meridians. The origin of the graticule (0,0) is defined by where the equator and prime meridian intersect. The globe is then divided into four geographical quadrants that are based on compass bearings from the origin. North and south are above and below the equator, and west and east are to the left and right of the prime meridian.
Latitude and longitude values are traditionally measured either in decimal degrees or in degrees, minutes, and seconds (DMS). Latitude values are measured relative to the equator and range from -90° at the South Pole to +90° at the North Pole. Longitude values are measured relative to the prime meridian. They range from -180° when traveling west to 180° when traveling east. If the prime meridian is at Greenwich, then Australia, which is south of the equator and east of Greenwich, has positive longitude values and negative latitude values.
It may be helpful to equate longitude values with X and latitude values with Y. Data defined on a geographic coordinate system is displayed as if a degree is a linear unit of measure. This method is basically the same as the Plate Carrée projection.
Although longitude and latitude can locate exact positions on the surface of the globe, they are not uniform units of measure. Only along the equator does the distance represented by one degree of longitude approximate the distance represented by one degree of latitude. This is because the equator is the only parallel as large as a meridian. (Circles with the same radius as the spherical earth are called great circles. The equator and all meridians are great circles.)
Above and below the equator, the circles defining the parallels of latitude get gradually smaller until they become a single point at the North and South Poles where the meridians converge. As the meridians converge toward the poles, the distance represented by one degree of longitude decreases to zero. Because degrees of latitude and longitude don’t have a standard length, you can’t measure distances or areas accurately or display the data easily on a flat map or computer screen.
Datum
While a spheroid approximates the shape of the earth, a datum defines the position of the spheroid relative to the center of the earth. A datum provides a frame of reference for measuring locations on the surface of the earth. It defines the origin and orientation of latitude and longitude lines.
Whenever you change the datum, or more correctly, the geographic coordinate system, the coordinate values of your data will change. Here are the coordinates in degrees/minutes/seconds (DMS) of a control point in Redlands, California, on the North American Datum of 1983 (NAD 1983 or NAD83):
34 01 43.77884 -117 12 57.75961
Here’s the same point on the North American Datum of 1927 (NAD 1927 or NAD27):
34 01 43.72995 -117 12 54.61539
The longitude value differs by approximately 3 seconds, while the latitude value differs by about 0.05 seconds.
NAD 1983 and the World Geodetic System of 1984 (WGS 1984) are identical for most applications. Here are the coordinates for the same control point based on WGS 1984:
34 01 43.778837 -117 12 57.75961
Geocentric datums
In the last 15 years, satellite data has provided geodesists with new measurements to define the best earth-fitting spheroid, which relates coordinates to the earth’s center of mass. An earth-centered, or geocentric, datum uses the earth’s center of mass as the origin. The most recently developed and widely used datum is WGS 1984. It serves as the framework for locational measurement worldwide.
Local datums
A local datum aligns its spheroid to closely fit the earth’s surface in a particular area. A point on the surface of the spheroid is matched to a particular position on the surface of the earth. This point is known as the origin point of the datum. The coordinates of the origin point are fixed, and all other points are calculated from it.
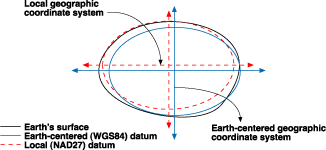
The coordinate system origin of a local datum is not at the center of the earth. The center of the spheroid of a local datum is offset from the earth’s center. NAD 1927 and the European Datum of 1950 (ED 1950) are local datums. NAD 1927 is designed to fit North America reasonably well, while ED 1950 was created for use in Europe. Because a local datum aligns its spheroid so closely to a particular area on the earth’s surface, it’s not suitable for use outside the area for which it was designed.
North American Datums
The two horizontal datums used almost exclusively in North America are NAD 1927 and NAD 1983
NAD 1927
NAD 1927 uses the Clarke 1866 spheroid to represent the shape of the earth. The origin of this datum is a point on the earth referred to as Meades Ranch in Kansas. Many NAD 1927 control points were calculated from observations taken in the 1800s. These calculations were done manually and in sections over many years. Therefore, errors varied from station to station.
NAD 1983
Many technological advances in surveying and geodesy—electronic theodolites, Global Positioning System (GPS) satellites, Very Long Baseline Interferometry, and Doppler systems—revealed weaknesses in the existing network of control points. Differences became particularly noticeable when linking existing control with newly established surveys. The establishment of a new datum allowed a single datum to cover consistently North America and surrounding areas.
The North American Datum of 1983 is based on both earth and satellite observations, using the Geodetic Reference System (GRS) 1980 spheroid. The origin for this datum was the earth’s center of mass. This affects the surface location of all longitude–latitude values enough to cause locations of previous control points in North America to shift, sometimes as much as 500 feet compared to NAD 1927. A 10-year multinational effort tied together a network of control points for the United States, Canada, Mexico, Greenland, Central America, and the Caribbean.
The GRS 1980 spheroid is almost identical to the World Geodetic System (WGS) 1984 spheroid. The WGS 1984 and NAD 1983 coordinate systems are both earth-centered. When originally published in 1986, NAD 1983 and WGS 1984 could be considered coincident. That is no longer true. WGS 1984 is tied to the International Terrestrial Reference Frame (ITRF). NAD 1983 is tied to the North American tectonic plate to minimize changes to coordinate values over time. This has caused NAD 1983 and WGS 1984 to drift apart. Generally, coordinates in WGS 1984 and NAD 1983 are around one to two meters apart. GPS data is actually reported in the WGS 1984 coordinate system. However, if any type of external control network is being used, such as the Continuously Operating Reference Stations (CORS) service, the GPS coordinates are relative to that coordinate system, not WGS 1984.
HARN or HPGN
There was an ongoing effort at the state level to readjust the NAD 1983 datum to a higher level of accuracy using state-of-the-art surveying techniques that were not widely available when the NAD 1983 datum was being developed. This effort, known as the High Accuracy Reference Network (HARN)—previously the High Precision Geodetic Network (HPGN)—was a cooperative project between the National Geodetic Survey (NGS) and individual states.
Currently, all states except Alaska have been resurveyed, and transformation grid files for 49 states and five territories have been published. Control points that have been adjusted are labeled in the National Geodetic Survey database as NAD83 (19xx) or NAD83 (20xx) where xx represents the year of adjustment. Some points have been adjusted several times, and the year may not be the same as the original HARN readjustment. NGS has never released transformations to convert between an original HARN and later readjustments.
Converting degrees-minutes-seconds values to decimal Ddegree values
The following is the simple equation to convert degrees, minutes, and seconds into decimal degrees:
DD = (Seconds/3600) + (Minutes/60) + Degrees
The conversion must be handled differently if the degrees value is negative. Here’s one way:
DD = - (Seconds/3600) - (Minutes/60) + Degrees
Spheroids and spheres
he shape and size of a geographic coordinate system’s surface is defined by a sphere or spheroid. Although the earth is best represented by a spheroid, it is sometimes treated as a sphere to make mathematical calculations easier. The assumption that the earth is a sphere is possible for small-scale maps (smaller than 1:5,000,000). At this scale, the difference between a sphere and a spheroid is not detectable on a map. However, to maintain accuracy for larger-scale maps (scales of 1:1,000,000 or larger), the shape of the earth is necessary to be represented by a spheroid. Between those scales, choosing to use a sphere or spheroid will depend on the map’s purpose and the accuracy of the data.
Definition of a spheroid
The shape of an ellipse is defined by two radii: The longer radius is called the semimajor axis, and the shorter radius is called the semiminor axis. The semimajor axis, or equatorial radius, is half the major axis. the semiminor axis, or polar radius, is half the minor axis. The semimajor axis is in the equatorial plane, while the semiminor axis is perpendicular to the equatorial plane.
A spheroid is defined by either the semimajor axis, a a a, and the semiminor axis, b b b, or by a a a and the flattening. The flattening is the difference in length between the two axes expressed as a fraction or a decimal. The flattening, f f f, is derived as follows: f = ( a − b ) / a f = (a-b)/a f=(a−b)/a. The flattening is a small value, so usually the quantity 1/f is used instead. These are the spheroid parameters for the World Geodetic System of 1984 (WGS 1984 or WGS84):
a = 6378137.0 meters
b = 6356752.31424 meters
1/f = 298.257223563
The flattening ranges from 0 to 1. A flattening value of 0 means the two axes are equal, resulting in a sphere. The flattening of the earth is approximately 0.003353. Another quantity that, like the flattening, describes the shape of a spheroid is the square of the eccentricity, e 2 e^2 e2. It is represented by the following: e 2 = ( a 2 − b 2 ) / a 2 e^2 = (a^2-b^2)/a^2 e2=(a2−b2)/a2.
Defining different spheroids for accurate mapping
The earth has been surveyed many times to better understand its surface features and their peculiar irregularities. The surveys have resulted in many spheroids that represent the earth. Generally, a spheroid is chosen to fit one country or a particular area. A spheroid that best fits one region is not necessarily the same one that fits another region. Until recently, North American data used a spheroid determined by Clarke in 1866. The semimajor axis of the Clarke 1866 spheroid is 6,378,206.4 meters, and the semiminor axis is 6,356,583.8 meters.
Because of gravitational and surface feature variations, the earth is neither a perfect sphere nor a perfect spheroid. Satellite technology has revealed several elliptical deviations; for example, the South Pole is closer to the equator than the North Pole. Satellite-determined spheroids are replacing the older ground-measured spheroids. For example, the new standard spheroid for North America is the Geodetic Reference System of 1980 (GRS 1980), whose radii are 6,378,137.0 and 6,356,752.31414 meters. The GRS 1980 spheroid parameters were set by the International Union for Geodesy and Geophysics in 1979.
Because changing a coordinate system’s spheroid will change all feature coordinate values, many organizations haven’t switched to newer (and more accurate) spheroids.
The Projection Coordinate System
The process converting the spherical coordinate into the plane coordinate is called projection. The essence of a projected coordinate system is a plane coordinate system defined in the two-dimensional plane, usually in meters. Unlike geographic coordinates, the length, angle, and area of a projected coordinate system are constant in a two-dimensional space. Projection coordinate system are always based on geographic coordinate system: “Projection coordinate system = geographic coordinate system + projection algorithm”.
The projection coordinate system of our country mainly adopts Gauss-Kruger projection, which is divided into 6-degree and 3-degree zonal projection. The 1:25,000 to 1:500,000 scale topographic map adopts the 6-degree zonal difference, and the 1:10,000 scale topographic map adopts the 3-degree difference. The specific zoning method is as follows: the 6-degree zoning starts from the prime meridian and is divided into a projection zone from west to east according to the difference of longitude by 6 degrees. There are a total of 60 projection zones in the world, spanning 13-23 zones in China.
A projected coordinate system is defined on a flat, two-dimensional surface. Unlike a geographic coordinate system, a projected coordinate system has constant lengths, angles, and areas across the two dimensions. A projected coordinate system is always based on a geographic coordinate system that is based on a sphere or spheroid.
In a projected coordinate system, locations are identified by x,y coordinates on a grid, with the origin at the center of the grid. Each position has two values that reference it to that central location. One specifies its horizontal position and the other its vertical position. The two values are called the x-coordinate and y-coordinate. Using this notation, the coordinates at the origin are x = 0 and y = 0.
On a gridded network of equally spaced horizontal and vertical lines, the horizontal line in the center is called the x-axis and the central vertical line is called the y-axis. Units are consistent and equally spaced across the full range of x and y. Horizontal lines above the origin and vertical lines to the right of the origin have positive values; those below or to the left have negative values. The four quadrants represent the four possible combinations of positive and negative X and Y coordinates.
When working with data in a geographic coordinate system, it is sometimes useful to equate the longitude values with the X axis and the latitude values with the Y axis.
map projections
Whether you treat the earth as a sphere or a spheroid, you must transform its three-dimensional surface to create a flat map sheet. This mathematical transformation is commonly referred to as a map projection. One easy way to understand how map projections alter spatial properties is to visualize shining a light through the earth onto a surface, called the projection surface. Imagine the earth’s surface is clear with the graticule drawn on it. Wrap a piece of paper around the earth. A light at the center of the earth will cast the shadows of the graticule onto the piece of paper. You can now unwrap the paper and lay it flat. The shape of the graticule on the flat paper is different from that on the earth. The map projection has distorted the graticule.
Representing the earth’s surface in two dimensions causes distortion in the shape, area, distance, or direction of the data.
A map projection uses mathematical formulas to relate spherical coordinates on the globe to flat, planar coordinates.
Different projections cause different types of distortions. Some projections are designed to minimize the distortion of one or two of the data’s characteristics. A projection could maintain the area of a feature but alter its shape. In the graphic below, data near the poles is stretched.
Map projections are designed for specific purposes. One map projection might be used for large-scale data in a limited area, while another is used for a small-scale map of the world. Map projections designed for small-scale data are usually based on spherical rather than spheroidal geographic coordinate systems.
Conformal projections
Conformal projections preserve local shape. To preserve individual angles describing the spatial relationships, a Conformal projection must show the perpendicular graticule lines intersecting at 90-degree angles on the map. A map projection accomplishes this by maintaining all angles. The drawback is that the area enclosed by a series of arcs may be greatly distorted in the process. No map projection can preserve shapes of larger regions.
Equal area projections
Equal area projections preserve the area of displayed features. To do this, the other properties—shape, angle, and scale—are distorted. In Equal area projections, the meridians and parallels may not intersect at right angles. In some instances, especially maps of smaller regions, shapes are not obviously distorted, and distinguishing an Equal area projection from a Conformal projection is difficult unless documented or measured.
Equidistant projections
Equidistant maps preserve the distances between certain points. Scale is not maintained correctly by any projection throughout an entire map. However, there are in most cases, one or more lines on a map along which scale is maintained correctly. Most Equidistant projections have one or more lines in which the length of the line on a map is the same length (at map scale) as the same line on the globe, regardless of whether it is a great or small circle, or straight or curved. Such distances are said to be true. For example, in the Sinusoidal projection, the equator and all parallels are their true lengths. In other Equidistant projections, the equator and all meridians are true. Still others (for example, Two-point Equidistant) show true scale between one or two points and every other point on the map. Keep in mind that no projection is equidistant to and from all points on a map.
True-direction projections
The shortest route between two points on a curved surface such as the earth is along the spherical equivalent of a straight line on a flat surface. That is the great circle on which the two points lie. True-direction, or Azimuthal, projections maintain some of the great circle arcs, giving the directions or azimuths of all points on the map correctly with respect to the center. Some True-direction projections are also conformal, equal area, or equidistant.