上一篇爬取bilibili的弹幕进行图云展示:爬取B站《夏洛特烦恼》字幕词云展示,是爬取数据+数据展示结合的范例,这里将介绍爬虫的常用工具;
目录
常用工具
数据爬取的3个步骤:下载数据---解析数据---分析数据,里面用到一些常用工具,requests是下载url内容,正则表达式、beautifulsoup和lxml是对html文档解析快速定位想要的内容,tqdm能够显示处理进度,ffmpy处理视频流,matplotlib和seaborn对数据进行可视化分析和展示;
-
Requests
requests包提供针对URL的get、put、post、delete等方法模拟交互,response.text返回的是Unicode格式,通常需要转换为utf-8格式,否则就是乱码。response.content是二进制模式,可以下载视频之类的,如果想看的话需要decode成utf-8格式。
不管是通过response.content.decode("utf-8)的方式还是通过response.encoding="utf-8"的方式都可以避免乱码的问题发生。
response  = requests.get("https://www.baidu.com")
print(type(response))
print(response.status_code)
print(type(response.text))
response.enconding = "utf-8'
print(response.text)
print(response.cookies)
print(response.content)
print(response.content.decode("utf-8"))
带参数和头部的get请求:
url = 'http://www.baidu.com'
headers={
        "User-Agent" : "Mozilla/5.0 (Windows NT 10.0; Win64; x64; rv:72.0) Gecko/20100101 Firefox/72.0"
         }
data = {
    'name':'yzg',
    'age':'18'
}
response = requests.get(url,params=data,headers=headers)
print(response.url)
print(response.text)
post数据到url地址:
url = 'http://xxx'
data = {
    'name':'yzg',
    'age':'23'
    }
response = requests.post(url,data=data)
print(response.text)
得到url访问后的响应:
response = requests.get("http://www.baidu.com")
#打印请求页面的状态(状态码)
print(type(response.status_code),response.status_code)
#打印请求网址的headers所有信息
print(type(response.headers),response.headers)
#打印请求网址的cookies信息
print(type(response.cookies),response.cookies)
#打印请求网址的地址
print(type(response.url),response.url)
#打印请求的历史记录(以列表的形式显示)
print(type(response.history),response.history)
获取cookies,可以用作会话保持;
response = requests.get('https://www.baidu.com')
print(response.cookies)
for key,value in response.cookies.items():
    print(key,'==',value)

url = 'http://xxxx'
cookies = {'xx': 'x', 'xx': 'y'}
r = requests.get(url, cookies=cookies)
print(r.json())-
lxml
lxml是一个解析库,支持HTML/XML/XPath的解析方式,而且解析效率非常高,XPath(XML Path Language)是一门在XML文档中查找信息的语言,它最初是用来搜寻XML文档的,但是它同样适用于HTML文档的搜索;
XPath的更多用法参考:http://www.w3school.com.cn/xpath/index.asp
python lxml库的更多用法参考:http://lxml.de/
xpath的常用规则:
| 表达式 | 描述 |
| nodename | 选取此节点的所有子节点 |
| / | 从当前节点选取直接子节点 |
| // | 从当前节点选取子孙节点 |
| . | 选取当前节点 |
| .. | 选取当前节点的父节点 |
| @ | 选取属性 |
| * | 通配符,选择所有元素节点与元素名 |
| @* | 选取所有属性 |
| [@attrib] | 选取具有给定属性的所有元素 |
| [@attrib='value'] | 选取给定属性具有给定值的所有元素 |
| [tag] | 选取所有具有指定元素的直接子节点 |
| [tag='text'] | 选取所有具有指定元素并且文本内容是text节点 |
读取文本,解析节点:
from lxml import etree

text='''
<div>
    <ul>
         <li class="item-0"><a href="link1.html">第一个</a></li>
         <li class="item-1"><a href="link2.html">second item</a></li>
         <li class="item-0"><a href="link5.html">a属性</a>
     </ul>
 </div>
'''
html=etree.HTML(text) #初始化生成一个XPath解析对象
result=etree.tostring(html,encoding='utf-8')   #解析对象输出代码
print(type(html))
print(type(result))
print(result.decode('utf-8'))
根据爬取的url地址进行解析,使用xpath解析方式得到d标签的text内容:
url = 'https://api.bilibili.com/x/v1/dm/list.so?oid=183896111'
headers={
        "User-Agent" : "Mozilla/5.0 (Windows NT 10.0; Win64; x64; rv:72.0) Gecko/20100101 Firefox/72.0"
         }
response=requests.get(url,headers=headers)
html=etree.HTML(response.content)
d_list=html.xpath("//d//text()")-
BeautifulSoup
同lxml一样,BeautifulSoup也是一个xml格式的解析器,相对而言更容易不涉及xpath的知识内容,beautifulsoup会在解析时把整个网页内容加载到DOM树里,内存开销和耗时都比较高,处理海量内容时不建议使用。不过BeautifulSoup不需要结构清晰的网页内容,因为它可以直接find到我们想要的标签,如果对于一些HTML结构不清晰的网页,它比较适合;
使用方式可以参考:https://www.crummy.com/software/BeautifulSoup/
from bs4 import BeautifulSoup
html = """
<html><head><title>haha,The Dormouse's story</title></head>
<body>
<p class="title" name="dromouse"><b>The Dormouse's story</b></p>
<p class="story">Once upon a time there were three little sisters; and their names were
<a href="http://example.com/elsie" class="sister" id="link1"><!-- Elsie --></a>,
<a href="http://example.com/lacie" class="sister" id="link2">Lacie</a> and
<a href="http://example.com/tillie" class="sister" id="link3">Tillie</a>;
and they lived at the bottom of a well.</p>
<p class="story">...</p>
"""

soup = BeautifulSoup(html,'lxml')
# print(soup.prettify())   # 格式化
print(soup.title)
print(soup.title.name)
print(soup.title.string)
print(soup.title.parent.name)
print(soup.p)  # p标签
print(soup.p["class"])
print(soup.a)
print(soup.find_all('a'))
print(soup.find(id='link3'))-
tqdm
tqdm 是Python进度条,可以在 Python 长循环中添加一个进度提示信息,用户只需要封装任意的迭代器 tqdm(iterator),在遍历数据爬取后写入本地的过程中可以使用tqdm进行进度条的显示:
# 方法1:
import time
from tqdm import tqdm
for i in tqdm(range(100)):
    time.sleep(0.01)

#方法2:
import time
from tqdm import trange
for i in trange(100):
    time.sleep(0.01)
可以为进度条设置描述:
pbar = tqdm(["a", "b", "c", "d"])
for char in pbar:
    # 设置描述
    pbar.set_description("Processing %s" % char)
time.sleep(1)![]()
-
ffmpy3
ffmpy3 是 ffmpy 的一个分支,它是一个简单的 FFmpeg 命令行包装程序。ffmpy 实现了一个 Pythonic 接口,用于通过命令行执行 FFmpeg,并使用 Python 的子进程模块进行同步执行
import ffmpy3
ff = ffmpy3.FFmpeg(
    inputs={'input.mp4': None},
    outputs={'output.avi': None}
)
ff.run()-
matplotlib
matplotlib是 Python 最著名的绘图库,它提供了一整套和 matlab 相似的命令 API,十分适合交互式地进行制图。而且也可以方便地将它作为绘图控件,seaborn也是基于matplotlib封装,但matplotlib更加底层,提供的功能更加丰富,参考:https://matplotlib.org/
matplotlib.pyplot是一个有命令风格的函数集合,每一个pyplot函数都使一副图像做出些许改变,例如创建一幅图,在图中创建一个绘图区域,在绘图区域中添加一条线等等。在matplotlib.pyplot中,各种状态通过函数调用保存起来,以便于可以随时跟踪像当前图像和绘图区域这样的东西。绘图函数是直接作用于当前axes(matplotlib中的专有名词,图形中组成部分,不是数学中的坐标系。)
import matplotlib.pyplot as plt
plt.plot([2,4,7,18])
plt.ylabel('some numbers')
plt.show()
%matplotlib inline
Figure:在任何绘图之前,我们需要一个Figure对象,可以理解成我们需要一张画板才能开始绘图。
import matplotlib.pyplot as plt
fig = plt.figure()
%matplotlib inlineAxes:Figure对象之后需要定义轴,需要添加Axes;这里figure里面装了3个图;
fig = plt.figure()
ax1 = fig.add_subplot(131)
ax2 = fig.add_subplot(132)
ax3 = fig.add_subplot(133)
ax1.set(xlim=[0.5, 4.5], ylim=[-2, 8], title='An Example Axes',ylabel='Y-Axis', xlabel='X-Axis')
ax2.set(xlim=[0.5, 4.5], ylim=[-2, 8], title='An Example Axes',ylabel='Y-Axis', xlabel='X-Axis')
ax3.set(xlim=[0.5, 4.5], ylim=[-2, 8], title='An Example Axes',ylabel='Y-Axis', xlabel='X-Axis')
plt.show()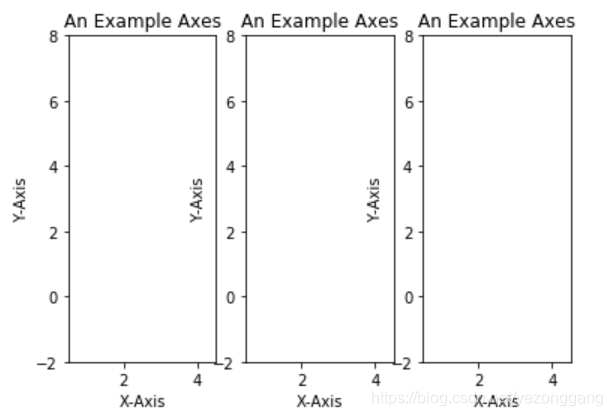
也可以一次性定义子图个数和axes坐标轴;
fig, axes = plt.subplots(nrows=2, ncols=2)
axes[0,0].set(title='Upper Left')
axes[0,1].set(title='Upper Right')
axes[1,0].set(title='Lower Left')
axes[1,1].set(title='Lower Right')
matplotlib提供线图、散点图、直方图、分布图、饼图、关系图等,可以在此基础上探究;
-
seaborn
关于seaborn结合pandas的数据处理,在我前面的博文中有详细的使用方式:seaborn数据可视化探索(tips 数据集)