两个指标分组一次画图,不需要遍历
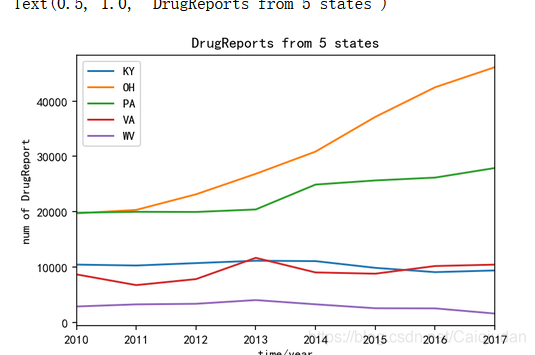
# 5个州的药品报告
nf.groupby(['YYYY','State']).DrugReports.sum().unstack().plot()
plt.ylabel('num of DrugReport')
plt.xlabel('time/year')
plt.title('DrugReports from 5 states') # 5个州的药品报告
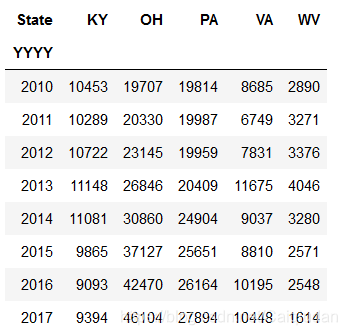
其中nf.groupby(['YYYY','State']).DrugReports.sum().unstack()