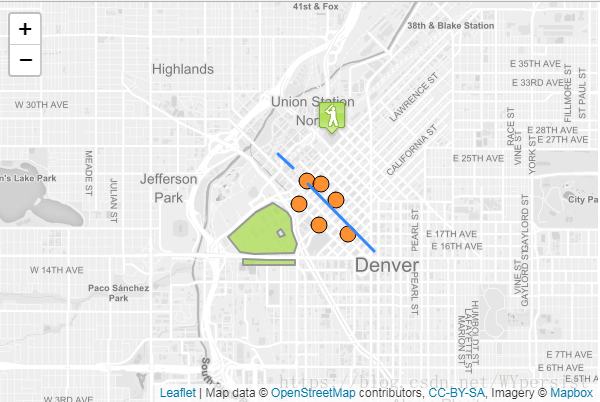
GeoJSON正在成为许多GIS技术和服务中非常流行的数据格式 - 它非常简单,轻量级,简单明了,Leaflet在处理它方面非常出色。在本例中,您将学习如何创建从GeoJSON对象创建的地图矢量并与其交互。
关于GeoJSON
GeoJSON是用于编码各种地理数据结构的格式。GeoJSON对象可以表示几何,特征或特征的集合。GeoJSON支持以下几何类型:Point,LineString,Polygon,MultiPoint,MultiLineString,MultiPolygon和GeometryCollection。GeoJSON中的功能包含几何对象和附加属性,功能集合表示功能列表。
Leaflet支持上述所有GeoJSON类型,但Feature和FeatureCollections的效果最好,因为它们允许您使用一组属性来描述要素。我们甚至可以使用这些属性来设计我们的Leaflet矢量。以下是一个简单的GeoJSON功能的例子:
var geojsonFeature = {
    "type": "Feature",
    "properties": {
        "name": "Coors Field",
        "amenity": "Baseball Stadium",
        "popupContent": "This is where the Rockies play!"
    },
    "geometry": {
        "type": "Point",
        "coordinates": [-104.99404, 39.75621]
    }
};
GeoJSON图层
GeoJSON对象通过GeoJSON图层添加到地图中。要创建它并将其添加到地图,我们可以使用以下代码:
L.geoJSON(geojsonFeature).addTo(map);GeoJSON对象也可以作为有效的GeoJSON对象数组传递。
var myLines = [{
    "type": "LineString",
    "coordinates": [[-100, 40], [-105, 45], [-110, 55]]
}, {
    "type": "LineString",
    "coordinates": [[-105, 40], [-110, 45], [-115, 55]]
}];
或者,我们可以创建一个空的GeoJSON图层并将其分配给一个变量,以便我们可以在稍后添加更多功能。
var myLayer = L.geoJSON().addTo(map);
myLayer.addData(geojsonFeature);
选项
样式
该style选项可用于以两种不同方式设置功能。首先,我们可以传递一个简单的对象,以相同的方式对所有路径(折线和多边形)进行样式设置:
var myLines = [{
    "type": "LineString",
    "coordinates": [[-100, 40], [-105, 45], [-110, 55]]
}, {
    "type": "LineString",
    "coordinates": [[-105, 40], [-110, 45], [-115, 55]]
}];

var myStyle = {
    "color": "#ff7800",
    "weight": 5,
    "opacity": 0.65
};

L.geoJSON(myLines, {
    style: myStyle
}).addTo(map);或者,我们可以传递一个函数,根据它们的属性设置各个特征的样式。在下面的例子中,我们检查“party”属性并相应地设置我们的多边形样式:
var states = [{
    "type": "Feature",
    "properties": {"party": "Republican"},
    "geometry": {
        "type": "Polygon",
        "coordinates": [[
            [-104.05, 48.99],
            [-97.22,  48.98],
            [-96.58,  45.94],
            [-104.03, 45.94],
            [-104.05, 48.99]
        ]]
    }
}, {
    "type": "Feature",
    "properties": {"party": "Democrat"},
    "geometry": {
        "type": "Polygon",
        "coordinates": [[
            [-109.05, 41.00],
            [-102.06, 40.99],
            [-102.03, 36.99],
            [-109.04, 36.99],
            [-109.05, 41.00]
        ]]
    }
}];

L.geoJSON(states, {
    style: function(feature) {
        switch (feature.properties.party) {
            case 'Republican': return {color: "#ff0000"};
            case 'Democrat':   return {color: "#0000ff"};
        }
    }
}).addTo(map);
pointToLayer
点的处理方式与折线和多边形不同。默认情况下,为GeoJSON点绘制简单的标记。在创建GeoJSON图层时,我们可以通过pointToLayer在GeoJSON选项对象中传递函数来改变这一点。该函数传递一个LatLng并返回一个ILayer的实例,在这种情况下可能是Marker或CircleMarker。
这里我们使用pointToLayer选项来创建一个CircleMarker:
var geojsonMarkerOptions = {
    radius: 8,
    fillColor: "#ff7800",
    color: "#000",
    weight: 1,
    opacity: 1,
    fillOpacity: 0.8
};

L.geoJSON(someGeojsonFeature, {
    pointToLayer: function (feature, latlng) {
        return L.circleMarker(latlng, geojsonMarkerOptions);
    }
}).addTo(map);我们也可以style在这个例子中设置属性 - 如果您在pointToLayer函数内部创建了一个像圆圈一样的矢量图层,Leaflet足够聪明,可以将样式应用于GeoJSON点。
onEachFeature
该onEachFeature选项是在将每个功能添加到GeoJSON图层之前调用的功能。使用此选项的一个常见原因是在点击某个功能时附加弹出窗口。
function onEachFeature(feature, layer) {
    // does this feature have a property named popupContent?
    if (feature.properties && feature.properties.popupContent) {
        layer.bindPopup(feature.properties.popupContent);
    }
}

var geojsonFeature = {
    "type": "Feature",
    "properties": {
        "name": "Coors Field",
        "amenity": "Baseball Stadium",
        "popupContent": "This is where the Rockies play!"
    },
    "geometry": {
        "type": "Point",
        "coordinates": [-104.99404, 39.75621]
    }
};

L.geoJSON(geojsonFeature, {
    onEachFeature: onEachFeature
}).addTo(map);
过滤
该filter选项可用于控制GeoJSON功能的可见性。要做到这一点,我们传递一个函数作为filter选项。这个函数被GeoJSON图层中的每个要素调用,并且通过feature和layer。然后,您可以利用该功能属性中的值通过返回true或来控制可见性false。
在下面的例子中,“Busch Field”不会显示在地图上。
var someFeatures = [{
    "type": "Feature",
    "properties": {
        "name": "Coors Field",
        "show_on_map": true
    },
    "geometry": {
        "type": "Point",
        "coordinates": [-104.99404, 39.75621]
    }
}, {
    "type": "Feature",
    "properties": {
        "name": "Busch Field",
        "show_on_map": false
    },
    "geometry": {
        "type": "Point",
        "coordinates": [-104.98404, 39.74621]
    }
}];

L.geoJSON(someFeatures, {
    filter: function(feature, layer) {
        return feature.properties.show_on_map;
    }
}).addTo(map);
代码
<!DOCTYPE html>
<html>
<head>
<title>GeoJSON tutorial - Leaflet</title>
<meta charset="utf-8" />
<meta name="viewport" content="width=device-width, initial-scale=1.0">
<link rel="shortcut icon" type="image/x-icon" href="docs/images/favicon.ico" />
<link rel="stylesheet" href="https://unpkg.com/[email protected]/dist/leaflet.css" integrity="sha512-Rksm5RenBEKSKFjgI3a41vrjkw4EVPlJ3+OiI65vTjIdo9brlAacEuKOiQ5OFh7cOI1bkDwLqdLw3Zg0cRJAAQ==" crossorigin=""/>
<script src="https://unpkg.com/[email protected]/dist/leaflet.js" integrity="sha512-/Nsx9X4HebavoBvEBuyp3I7od5tA0UzAxs+j83KgC8PU0kgB4XiK4Lfe4y4cgBtaRJQEIFCW+oC506aPT2L1zw==" crossorigin=""></script>
<style>
html, body {
height: 100%;
margin: 0;
}
#map {
width: 600px;
height: 400px;
}
</style>
</head>
<body>
<div id='map'></div>
<script src="sample-geojson.js" type="text/javascript"></script>
<script>
var map = L.map('map').setView([39.74739, -105], 13);
L.tileLayer('https://api.tiles.mapbox.com/v4/{id}/{z}/{x}/{y}.png?access_token=pk.eyJ1IjoibWFwYm94IiwiYSI6ImNpejY4NXVycTA2emYycXBndHRqcmZ3N3gifQ.rJcFIG214AriISLbB6B5aw', {
maxZoom: 18,
attribution: 'Map data © <a href="https://www.openstreetmap.org/">OpenStreetMap</a> contributors, ' +
'<a href="https://creativecommons.org/licenses/by-sa/2.0/">CC-BY-SA</a>, ' +
'Imagery © <a href="https://www.mapbox.com/">Mapbox</a>',
id: 'mapbox.light'
}).addTo(map);
var baseballIcon = L.icon({
iconUrl: 'baseball-marker.png',
iconSize: [32, 37],
iconAnchor: [16, 37],
popupAnchor: [0, -28]
});
function onEachFeature(feature, layer) {
var popupContent = "<p>I started out as a GeoJSON " +
feature.geometry.type + ", but now I'm a Leaflet vector!</p>";
if (feature.properties && feature.properties.popupContent) {
popupContent += feature.properties.popupContent;
}
layer.bindPopup(popupContent);
}
L.geoJSON([bicycleRental, campus], {
style: function (feature) {
return feature.properties && feature.properties.style;
},
onEachFeature: onEachFeature,
pointToLayer: function (feature, latlng) {
return L.circleMarker(latlng, {
radius: 8,
fillColor: "#ff7800",
color: "#000",
weight: 1,
opacity: 1,
fillOpacity: 0.8
});
}
}).addTo(map);
L.geoJSON(freeBus, {
filter: function (feature, layer) {
if (feature.properties) {
// If the property "underConstruction" exists and is true, return false (don't render features under construction)
return feature.properties.underConstruction !== undefined ? !feature.properties.underConstruction : true;
}
return false;
},
onEachFeature: onEachFeature
}).addTo(map);
var coorsLayer = L.geoJSON(coorsField, {
pointToLayer: function (feature, latlng) {
return L.marker(latlng, {icon: baseballIcon});
},
onEachFeature: onEachFeature
}).addTo(map);
</script>
</body>
</html>