Echert 地址
https://echarts.apache.org/zh/download.html
Echert 案例地址
https://echarts.apache.org/examples/zh/index.html#chart-type-custom
项目安装
import echarts from 'echarts';
Vue.prototype.$ech = echarts;
组件上使用:
添加ID
<div id="wptjEchBox"></div>
methods创建行为(事件)
methods:{


	initPageEchert(){


		//初始化ID对象
	    this.controlObj = this.$ech.init(document.getElementById('wptjEchBox'));
	    //初始化参数
	    this.controlObj.setOption(实例参数);
	}
}
在生命周期DOM对象渲染后执行
mounted(){


   this.getDataFn(this.timeRange);
},
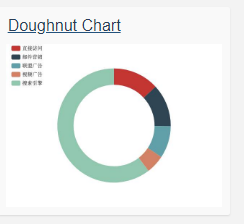
浏览器效果
