资源下载
git clone https://github.com/YuanbaoQiang/LAMMPS_TOOLBOX.git
所需数据格式
坐标1,坐标2,对应的值,和之前我的二维温度云图实现差不多,只不过这次所有的数据都是python处理的,没用excel,没用origin而已。
Coord1	Coord2	temp
1	39	34.4193
1	41	209.125
1	43	275.397
1	45	300.379
1	47	237.16299999999998
1	49	279.132
1	51	273.264
1	53	251.517
1	55	277.191
1	57	271.215
1	59	259.327
1	61	228.023
1	63	286.495
1	65	300.42
.......
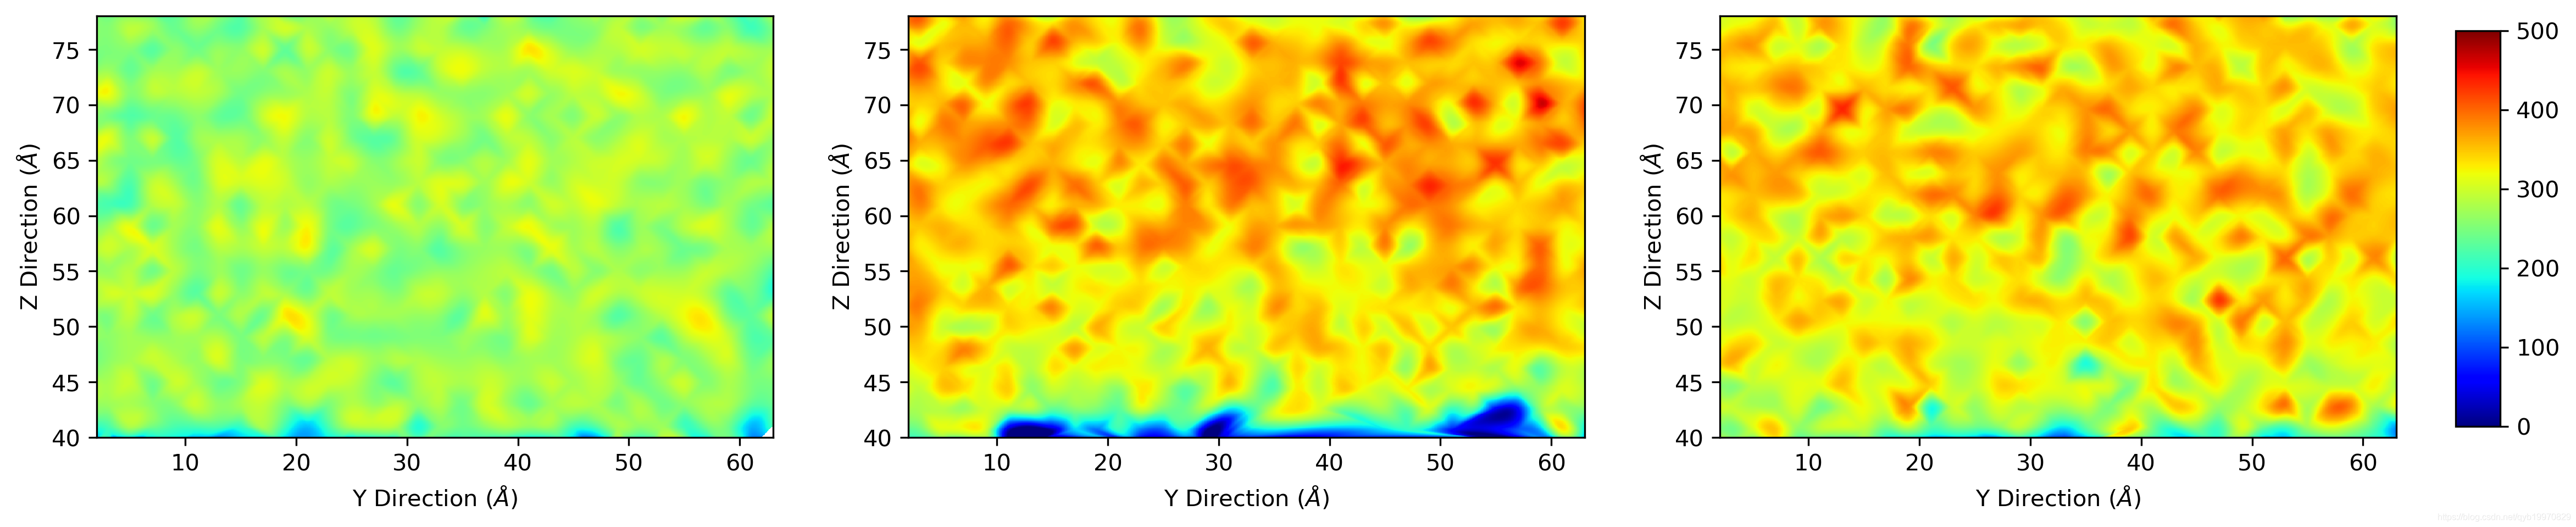
输出结果
参考
matplotlib 合理设置colorbar和子图的对应关系
Matplotlib.pyplot.imshow添加colorbar和刻度尺