前言
直方图(Histogram),又称质量分布图,是一种统计报告图,由一系列高度不等的纵向条纹或线段表示数据分布的情况。 一般用横轴表示数据类型,纵轴表示分布情况。
直方图是数值数据分布的精确图形表示。 这是一个连续变量(定量变量)的概率分布的估计,并且被卡尔·皮尔逊(Karl Pearson)首先引入。它是一种条形图。 为了构建直方图,第一步是将值的范围分段,即将整个值的范围分成一系列间隔,然后计算每个间隔中有多少值。 这些值通常被指定为连续的,不重叠的变量间隔。 间隔必须相邻,并且通常是(但不是必须的)相等的大小。(取自百度百科),简单过一下就好,无需在此处花时间。
一、简单直方图
1.代码
import numpy as np
import matplotlib.pyplot as plt
x = 100 + 15 * np.random.randn(1000)
fig, ax = plt.subplots()
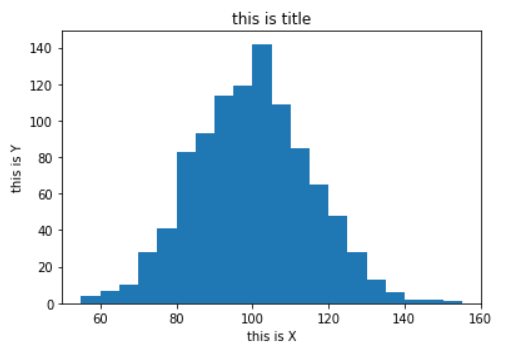
ax.hist(x, 20) #载入数据
ax.set_xlabel('this is X') #设置X轴标签
ax.set_ylabel('this is Y') #设置Y轴标签
ax.set_title('this is title') #设置直方图名称
plt.show()
2.运行结果
3.注释
1.ax.hist(x, 20)用于绘制直方图,1其中的x为随机产生的1000组数据。
#函数参数,了解即可无需深入
matplotlib.pyplot.hist(x, bins=None, range=None, density=None, weights=None, cumulative=False, bottom=None, histtype='bar', align='mid', orientation='vertical', rwidth=None, log=False, color=None, label=None, stacked=False, normed=None, *, data=None, **kwargs)
x:输入值,这需要单个数组或不需要具有相同长度的数组序列
bins:如果一个整数,bins +1,则计算并返回bin边缘,与之一致numpy.histogram()
其他参数我会在后面的教程中再进一步作出讲解,了解到这就OK了,贪多嚼不烂。
2.fig, ax = plt.subplots()是一个将多组数据放到一张图显示的操作,可以简单理解为多图合一操作。
其返回值
fig: matplotlib.figure.Figure 对象
ax:子图对象( matplotlib.axes.Axes)或者是他的数组
#函数定义看看就好了
def subplots(nrows=1, ncols=1, sharex=False, sharey=False, squeeze=True,
             subplot_kw=None, gridspec_kw=None, **fig_kw):
    fig = figure(**fig_kw)
    axs = fig.subplots(nrows=nrows, ncols=ncols, sharex=sharex, sharey=sharey,
                       squeeze=squeeze, subplot_kw=subplot_kw,
                       gridspec_kw=gridspec_kw)
    return fig, axs
3.numpy.random.randn(d0,d1,…,dn):randn函数返回一个或一组样本,具有标准正态分布。dn表格每个维度,返回值为指定维度的array。看代码的直观体现。
np.random.randn() # 当没有参数时,返回单个数据
#输出:-0.30117911192292973

np.random.randn(2,4)
'''
输出:
array([[-0.05176012, -0.04370378, -1.35124873,  1.56260502],
       [ 0.28565732, -1.80031882,  0.10318817,  1.05343294]])
'''

np.random.randn(4,3,2)
'''
输出:
array([[[ 0.54162814,  0.27067592],
        [-0.67345926, -0.7830058 ],
        [-0.52516213, -0.47652656]],

       [[-1.30022682,  0.23293469],
        [-1.54155924,  0.04649326],
        [ 0.06110925,  0.96038355]],

       [[-1.73759172,  1.0053545 ],
        [ 1.49968693,  0.50646915],
        [-0.1132959 , -0.42487007]],

       [[ 0.78368072,  1.80768154],
        [-0.49297587,  0.66436509],
        [ 0.35496744,  0.52050209]]])
'''
二、代码进阶
1.代码
import numpy as np
import matplotlib.pyplot as plt
n_bins = 10
x = np.random.randn(1000, 3)
fig, axes = plt.subplots(nrows=2, ncols=2) #subplots创建多个子图
ax0=axes[0,0]
ax1=axes[0,1]
ax2=axes[1,0]
ax3=axes[1,1]
colors = ['red', 'tan', 'lime']
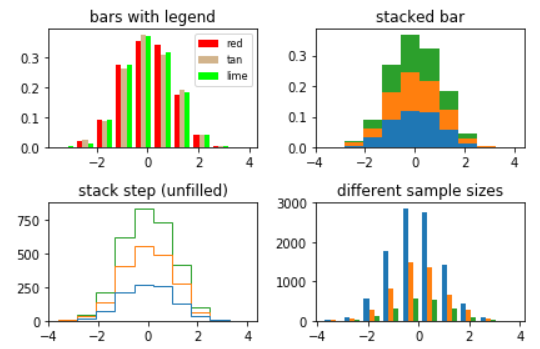
ax0.hist(x, n_bins, density=True, histtype='bar', color=colors, label=colors)
ax0.legend(prop={'size': 8})
ax0.set_title('bars with legend')
ax1.hist(x, n_bins, density=True, histtype='bar', stacked=True)
ax1.set_title('stacked bar')
ax2.hist(x, n_bins, histtype='step', stacked=True)
ax2.set_title('stack step (unfilled)')
x_multi = [np.random.randn(n) for n in [10000, 5000, 2000]]
ax3.hist(x_multi, n_bins, histtype='bar')
ax3.set_title('different sample sizes')
fig.tight_layout() #自动调整子图参数
plt.show()
2.运行结果
3.注释
1.plt.subplots(nrows=2, ncols=2)创建一个2*2的图像,即将四张图放在一张大图上显示。
nrows,ncols:整型,可选参数,默认为1。表示子图网格(grid)的行数与列数。
#函数参数,了解即可无需深入
matplotlib.pyplot.subplots(nrows=1, ncols=1, sharex=False, sharey=False, squeeze=True, subplot_kw=None, gridspec_kw=None, **fig_kw)
plt.subplots()与plt.subplot()的比较及其比较参见博客文章:【待写,记得提醒我啊】
2.ax.hist(density=True, histtype='bar', stacked=True)
density:如果是True,则返回元组的第一个元素为概率密度,即直方图面积和为1。
官网原文是
If True, the first element of the return tuple will be the counts normalized to form a probability density, i.e., the area (or integral) under the histogram will sum to 1. This is achieved by dividing the count by the number of observations times the bin width and not dividing by the total number of observations. If stacked is also True, the sum of the histograms is normalized to 1.
histtype:参数说明
“bar”是传统的条形直方图。如果给定多个数据,则条并排排列。
“barstacked”是一种条形直方图,其中多个数据相互叠加。
“step”生成默认为未填充的线条图。
“stepfilled”生成默认填充的线条图。
stacked:如果为True,则多个数据堆叠在一起;如果为False,则多个数据并排排列;默认为False。参照图一与图二。
3.fig.tight_layout():会自动调整子图参数,使它填充整个图像区域。它仅仅检查坐标轴标签、刻度标签以及标题的部分。看例子
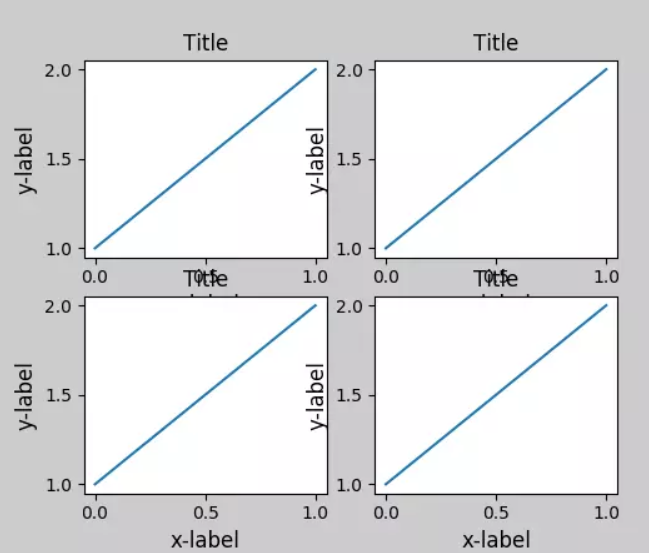
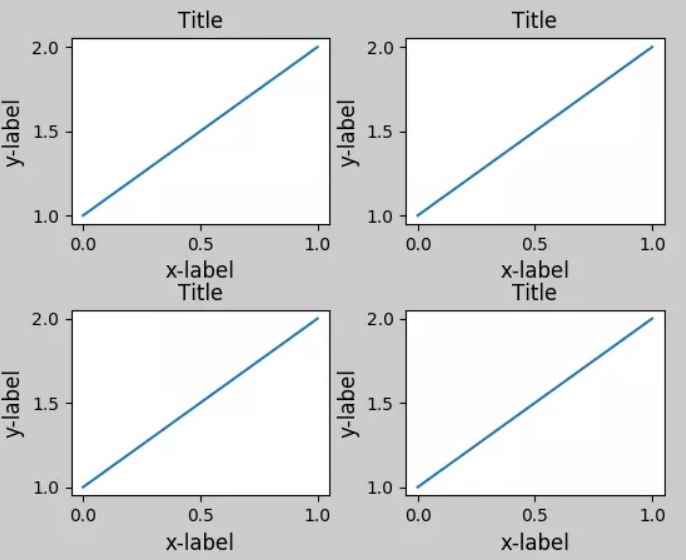
(这两张截图取自网络,侵删)
有不懂的可以在下方留言,我看到会回复的。