海 浪 模 拟 的 三 维 仿 真 研 究海浪
import matplotlib.pyplot as plt
import numpy as np
from mpl_toolkits.mplot3d import Axes3D
from matplotlib.animation import FuncAnimation
import random
import mpl_toolkits.mplot3d.axes3d as p3
fig = plt.figure()
ax = p3.Axes3D(fig)
ax.grid(False)
x = np.linspace(0,50)
y = x
s_list = []
w_list = []
for i in range(100):
w_list.append(random.uniform(0, 3.5))
s_list.append(random.uniform(0.00001, 0.003))
e = np.random.rand()*6.28
def add_list(X,Y):
global t
t += 0.05
k = 0.3
w = np.ones((50, 50))
Z = np.zeros((50, 50))
for i in range(len(w_list)):
Z += ((2*s_list[i]*1)**0.5)*np.cos(w_list[i]*t-k*X+e) + ((2*s_list[i]*1)**0.5)*np.cos(w_list[i]*t-k*Y+e)
return Z
def update(num,x,y):
#print(x.shape)
X, Y = np.meshgrid(x, y)
Z = add_list(X,Y)
#print(X.shape,Z.shape)
ax = plt.axes(projection='3d')
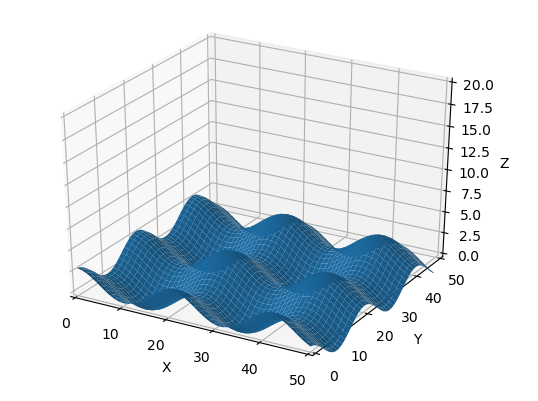
ax.set_xlim3d([0.0, 50])
ax.set_xlabel('X')
ax.set_ylim3d([0.0, 50])
ax.set_ylabel('Y')
ax.set_zlim3d([0.0,20])
ax.set_zlabel('Z')
#ax.view_init(elev=0,azim=0)
ax.plot_surface(X, Y, Z, rstride=1, cstride=1)
return ax
ani = FuncAnimation(fig, update, 1, fargs=(x,y),
interval=10, blit=False)
plt.show()