本文讲解如何在Vue中使用echarts及基于echarts的图云工具echarts-wordcloud并实现异步数据的加载和更新
先上展示图:
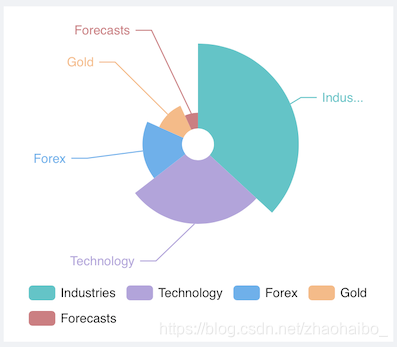
echarts:
echarts-wordcloud:

1. Vue中使用Echarts
Echarts官网详细说明了如何在webpack中使用Echarts:Echarts—教程
安装:
npm install echarts --save
要在Vue文件中引入echarts有多种常用方法:
方法一:如官方所说,在Vue文件中直接require:var echarts = require('echarts');,如:
export default {
  	data() {
    	return {
      		myChart: null,
    	};
  	},
  	mounted() {
    	this.initChart();
  	},
	methods: {
		initChart() {
      		let echarts = require("echarts");
      		this.myChart = echarts.init(this.$refs.chart1);
      		...
    	}
    }
}
方法二:在Vue文件中导入echarts包,如:
<template>
	<div ref="chart1" style="height:300px;"></div>
</template>
<script>
import echarts from 'echarts'
export default {
  	data() {
    	return {
      		myChart: null,
    	};
  	},
  	mounted() {
    	this.initChart();
  	},
	methods: {
		initChart() {
      		this.myChart = echarts.init(this.$refs.chart1);
      		...
    	}
    }
}
</script>
方法三:main.js中引入echarts包:import echarts from "echarts";,设定全局变量:Vue.prototype.$echarts = echarts;。该方法是最为推荐的
给出本文图1完整代码:
<template>
  <div ref="chart1" style="height:300px;"></div>
</template>
<script>
// 这里使用主题:macarons
require("echarts/theme/macarons");
export default {
  data() {
    return {
      myChart: null
    };
  },
  mounted() {
    this.initChart();
  },
  methods: {
    initChart() {
      this.myChart = this.$echarts.init(this.$refs.chart1, "macarons");
      this.myChart.setOption({
        tooltip: {
          trigger: "item",
          formatter: "{a} <br/>{b} : {c} ({d}%)"
        },
        legend: {
          left: "center",
          bottom: "10",
          data: ["Industries", "Technology", "Forex", "Gold", "Forecasts"]
        },
        series: [
          {
            name: "WEEKLY WRITE ARTICLES",
            type: "pie",
            roseType: "radius",
            radius: [15, 95],
            center: ["50%", "38%"],
            data: [
              { value: 320, name: "Industries" },
              { value: 240, name: "Technology" },
              { value: 149, name: "Forex" },
              { value: 100, name: "Gold" },
              { value: 59, name: "Forecasts" }
            ],
            animationEasing: "cubicInOut",
            animationDuration: 2600
          }
        ]
      });
    }
  }
};
</script>
上面使用了一个webpack安装echarts下的内置主题macarons,还有哪些可用主题?可以在node_modules/echarts/theme下查看。
这里记录一些好看的主题:
blue:

jazz:

vintage:

2.Vue使用echarts-wordcloud
github:echarts-wordcloud
按照官网的说法,使用echarts-wordcloud除了需要echarts包外,还需要额外安装echarts-wordcloud包,并引用该包。这里推荐和echarts包一样,在main.js中引用:import 'echarts-wordcloud'
词云最简代码:
<template>
  <div ref="Chart2" style="height:800px;"></div>
</template>
<script>
require("echarts-wordcloud");
export default {
  data: function() {
    return {
      myChart: null
    };
  },
  mounted() {
    this.initEchart();
  },
  methods: {
    initEchart() {
      this.myChart = this.$echarts.init(this.$refs.Chart2);
      this.myChart.setOption({
        series: [
          {
            type: "wordCloud",
            data: [{name:"活着", value:2352}, {name:"追风筝的人", value:123}]
          }
        ]
      });
    }
  }
};
</script>
具体有哪些option,可以去github里看readme
3. 实现异步数据加载和更新
这里的关键问题就是get数据和setOption的顺序问题。只要把setOption的任务放在get请求成功后的处理逻辑中即可。
给出词云完整代码:
<template>
  <div ref="keyWords" style="height:800px;"></div>
</template>
<script>
export default {
  data: function() {
    return {
      myChart: null
    };
  },
  mounted() {
    this.initEchart();
  },
  methods: {
    initEchart() {
      // this.$loading.show();
      this.myChart = this.$echarts.init(this.$refs.keyWords);
      this.myChart.showLoading();
      this.axios
        .get("http:xxxxxxx")
        .then(res => {
          let data = res.data;
          let list = [];
          for (let i = 0; i < data.length; i++) {
            let book_name = data[i]["book_name"];
            let comment_nums = data[i]["comment_nums"];
            list.push({ name: book_name, value: comment_nums });
          }
          this.myChart.hideLoading();
          this.myChart.setOption({
          backgroundColor:'#fff',
            tooltip: {
              pointFormat: "{series.name}: <b>{point.percentage:.1f}%</b>"
            },
            series: [
              {
                type: "wordCloud",
                gridSize: 2,
                shape: "circle",
                // shape: 'pentagon',
                sizeRange: [12, 50],
                // rotationRange: [-90, 90],
                // width: 600,
                // height: 300,
                left: "center",
                top: "center",
                width: "70%",
                height: "80%",
                right: null,
                bottom: null,
                drawOutOfBound: false,
                textStyle: {
                  normal: {
                    fontFamily: "sans-serif",
                    fontWeight: "bold",
                    color: function() {
                      return (
                        "rgb(" +
                        [
                          Math.round(Math.random() * 160),
                          Math.round(Math.random() * 160),
                          Math.round(Math.random() * 160)
                        ].join(",") +
                        ")"
                      );
                    }
                  },
                  emphasis: {
                    shadowBlur: 10,
                    shadowColor: "#333"
                  }
                },
                data: list
              }
            ]
          });
        });
      // this.$loading.hide();
    }
  }
};
</script>