文章目录
编程
往 pandas 中添加新的列
tmp['大流行']=0 #初始值为0的新列 ‘大流行’
pandas 将某列设置成索引
由于数据的某列包含 datetime,为了便宜行事,考虑将索引设置为该列。
设要设置成索引的列为 ‘B’:
data = data.set_index("B")
pandas 删除某一行
DataFrame.drop(labels=None,axis=0, index=None, columns=None, inplace=False)
若需要删除列,则在 index 中设置,并令 axis = 1 但要注意弄个括号。如有多列要删除,则输入列表,即 index = ([xx,xx])。
若要删除行,则在 index 中设置,用索引删除即可。
Pandas中Series或者DataFrame判断某个元素是否在存在
'Japan' in X['Country'].values
解得要在后面加上 .values。
如何将 pandas 改为 (x,1,y)的三元 np.array
由于序列预测问题中, LSTM 的输入必须是 (samples,lengths,features)。因此,如果将 lengths 设置为 1 ,也即根据上一次预测下一次的话,就必须把输入矩阵改为 (x,1,y)的模式。其实这个问题很扯淡,因为 LSTM 本身就具有学习性,因此大可将 lengths 设为 1。当然,如果序列问题是多输入,单输出的话,就可以将 lengths 设为大于 1。
论文写作
如何在表格中添加脚注
导入包\usepackage{threeparttable},然后在 \begin{tabular} 前加上\begin{threeparttable};在\end{tabular} 后加上下面的代码:
    \begin{tablenotes}
       \footnotesize
       \item[i]
其中 item[i] 对应表格中的脚注。需要脚注的地方加上 \tnote{i} ,在\end{tablenotes}之后加上\end{threeparttable},完毕
实例如下:
\begin{table}[H]
\centering
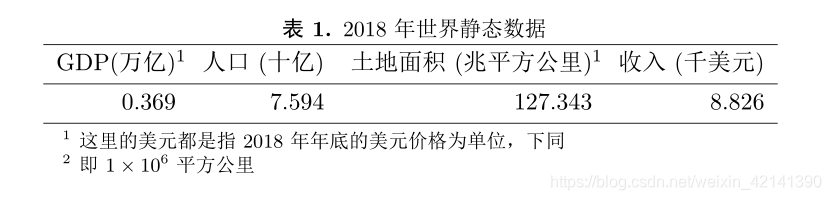
\caption{2018年世界静态数据}
\begin{threeparttable}
\begin{tabular}{rrrr}
\hline
\multicolumn{1}{l}{GDP(万亿)\tnote{1}} & \multicolumn{1}{l}{人口(十亿)} & \multicolumn{1}{l}{土地面积(兆平方公里)\tnote{1}} & \multicolumn{1}{l}{收入(千美元)} \bigstrut\\
\hline
0.369 & 7.594 & 127.343 & 8.826 \bigstrut\\
\hline
\end{tabular}%
\begin{tablenotes}
\footnotesize
\item[1] 这里的美元都是指2018年年底的美元价格为单位,下同
\item[2] 即$1\times10^6$平方公里
\end{tablenotes}
\end{threeparttable}
\label{tb:1}%
\end{table}
展示图:
给题注加脚注
可以在 caption{} 括号里面,加上一句\protect\footnotemark[1],在 end 之后,加上一句:\footnotetext[1]{xxxxxxxxxx}当然,可以修改中括号里面的内容,进而修改脚注的序号。
缺点在于,题注的脚注是另起的。
设置1级标题的序号为罗马,其余为数字
\renewcommand\thesection{\Roman{section}}
\renewcommand\thesubsubsection{\arabic{section}.\arabic{subsection}.\arabic{subsubsection}}
\renewcommand\thesubsection{\arabic{section}.\arabic{subsection}}
将某一行设置为左/右对齐
\leftline{尊敬的各位老师}     %左对齐
\rightline{书略陈固陋,勿劳赐复}    %右对齐
\rightline{时阴历四月廿六日}
插入 Matlab 代码 和 Python 代码
首先引入包:
\usepackage{listings}
\usepackage{color}
\definecolor{dkgreen}{rgb}{0,0.6,0}
\definecolor{gray}{rgb}{0.5,0.5,0.5}
\definecolor{mauve}{rgb}{0.58,0,0.82}
\lstset{frame=tb,
  language=Python,
  aboveskip=3mm,
  belowskip=3mm,
  showstringspaces=false,
  columns=flexible,
  basicstyle={\small\ttfamily},
  numbers=left,%设置行号位置none不显示行号
  %numberstyle=\tiny\courier, %设置行号大小
  numberstyle=\tiny\color{gray},
  keywordstyle=\color{blue},
  commentstyle=\color{dkgreen},
  stringstyle=\color{mauve},
  breaklines=true,
  breakatwhitespace=true,
  escapeinside=``,%逃逸字符(1左面的键),用于显示中文例如在代码中`中文...`
  tabsize=4,
  extendedchars=false %解决代码跨页时,章节标题,页眉等汉字不显示的问题
}
插入 Python 代码
\begin{lstlisting}
#代码放在这儿
\end{lstlisting}
插入 Matlab 代码
\lstset{language=Matlab}
\lstset{breaklines}%自动将长的代码行换行排版
\begin{lstlisting}
#代码放在这儿
\end{lstlisting}
使用枚举
很简单,不过要记得引入 enumerate 包,即\usepackage{enumerate},否则容易报错。
之后,对在\begin{enumerate}之后,加入 [(i)] ,里面可以设置成数字 1,分别对应枚举的标签为罗马字、阿拉伯字。
并排两章图像时,label 的使用
务必要记得,label 必须放在 caption 之后,否则出现三问号。
\begin{figure}[H]
\centering
\begin{minipage}[t]{0.48\textwidth}
\centering
\includegraphics[width=7.5cm]{./figure/pic6.png}
\caption{对整个地区进行U检验}
\label{fig1}    % 放在这里!!!!!!!!!!!!!!!!!!!!!!!!!!!!!!!!!!!!!!!
\end{minipage}
\begin{minipage}[t]{0.48\textwidth}
\centering
\includegraphics[width=7.5cm]{./figure/pic7.png}
\caption{对将地区拆分成许多地域再进行U检验,从而获得分布模型}
\label{fig2}
\end{minipage}
\end{figure}