给MATLAB初学者的几个题,自己也是初学者,肯定有错还望指出。
有源码没有详解,自己看懂才是真懂(不,应该是自己会写才是嘿嘿)
这是数学建模基础,以后还会推出更难的代码,当然还有数学建模的题和详解哦
1.求100-2500之间所有整数,使其各位数字立方和等于该数本身,如:
clear
clc
for n=0:2
    for i=1:9
        for j=0:9
            for k=0:9
                if (n*1000+i*100+j*10+k)==(n^3+i^3+j^3+k^3)
                    a=n*1000+i*100+j*10+k
                    if a>=2500
                        break
                    end
                end
            end
        end
    end
end
   153
   370
   371
   407
2.(基础编程)写出小于9999的、立方的末四位是8888的所有自然数的程序.
for i=1:9999
    a=i^3;
    if rem(a-8888,10000)==0
        disp(i)
    end
end
1942

4442

6942

9442
3.解方程组.

clear
a=[2 9 0;3 4 11;2 2 6];
b=[13.5 6.1 7.1]';
x = inv(a)*b
   10.0125
   -0.7250
   -1.9125
4.计算A矩阵的行列式、逆矩阵、特征值及特征向量.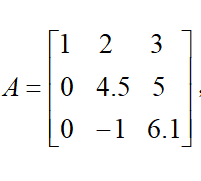
clear
A=[1 2 3;0 4.5 5;0 -1 6.1];
det(A)
inv(A)
[V,D]=eig(A);
V,D
ans =

   32.4500


ans =

    1.0000   -0.4684   -0.1079
         0    0.1880   -0.1541
         0    0.0308    0.1387
V =

   1.0000 + 0.0000i   0.4687 + 0.0074i   0.4687 - 0.0074i
   0.0000 + 0.0000i   0.8064 + 0.0000i   0.8064 + 0.0000i
   0.0000 + 0.0000i   0.1290 + 0.3368i   0.1290 - 0.3368i

D =

   1.0000 + 0.0000i   0.0000 + 0.0000i   0.0000 + 0.0000i
   0.0000 + 0.0000i   5.3000 + 2.0881i   0.0000 + 0.0000i
   0.0000 + 0.0000i   0.0000 + 0.0000i   5.3000 - 2.0881i

>>
5.(控制流语句使用)编程计算.

clear
m=0;
for i=2:19
    for j=1:i;
        m=m+j;
    end
end
m
1329
6.已知矩阵A,求出其最大值、最小值及其所处的位置(即:第几行第几列)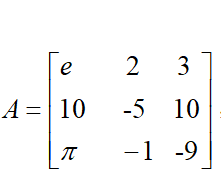
clear
A=[exp(1) 2 3;10 -5 10;pi -1 -9]
a=max(max(A))
b=find(a)
[m,n]=find(a==A)
q=[m,n]
q =

     2     1
     2     3
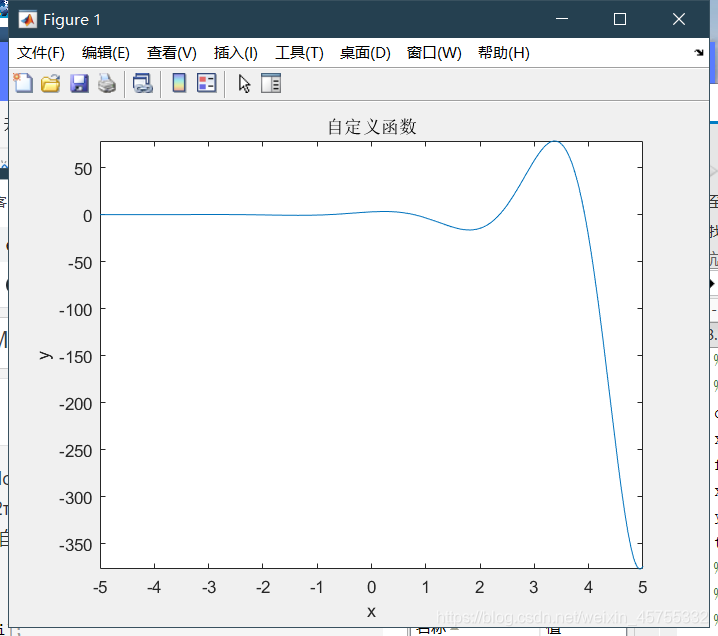
7.(自定义函数及fplot使用)自定义函数 ,并画出该函数在 上的图像。备注:横轴自变量,纵轴因变量,图形名称:自定义函数图形,线型、颜色自己选择。
x=[-2*pi:0.01:2*pi];
fplot(@(x) 3*exp(x)*cos(2*x))
xlabel("x")
ylabel('y')
title("自定义函数")
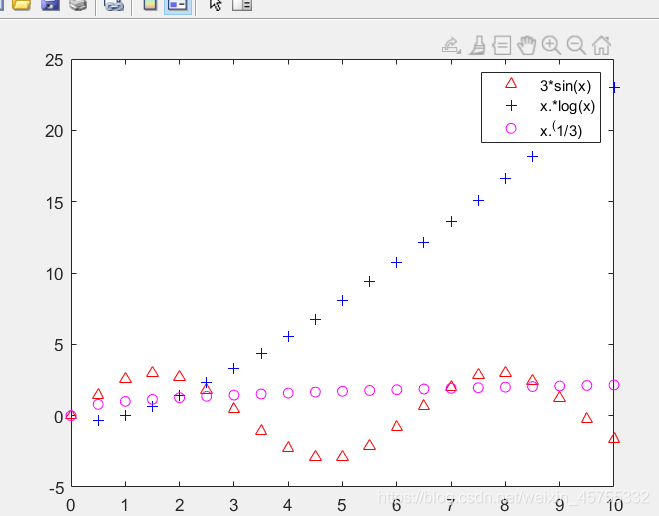
8. (plot使用)在一个图像内,画出3个函数
的曲线(对定义区间进行20等分),颜色分别用红色、蓝色、洋红色,线型分别用向上三角形、+号、圆圈o。并对三条线进行区分Legend标注。
clear
x=0:0.5:10;
plot(x,3*sin(x),'r^')
hold on
plot (x,x.*log(x),'b+')
hold on
plot(x,x.^(1/3),'mo')
legend('3*sin(x)','x.*log(x)','x.^(1/3)')
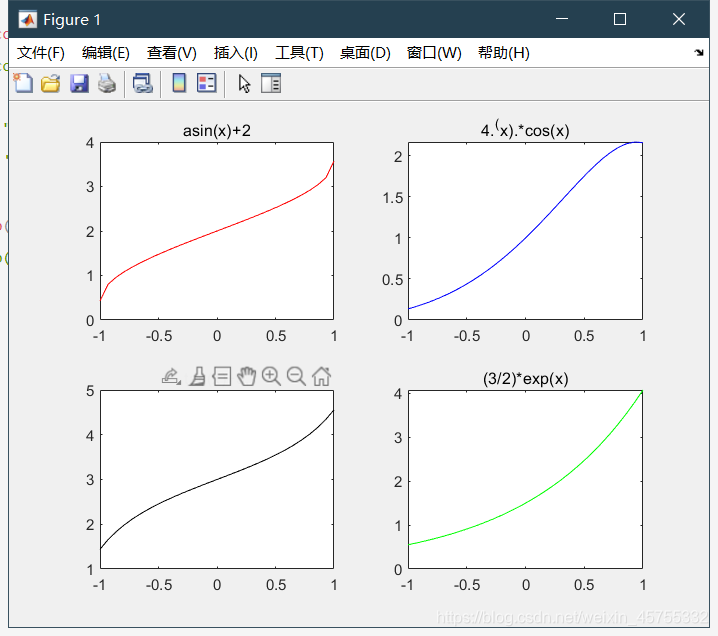
- ( subplot使用)在一个图像内,画出4个函数
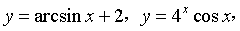
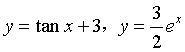
的曲线(对定义区间进行30等分),自己选择使用不同颜色和线形进行区分。并对4个图进行标注.
x=linspace(-1,1,30);
subplot(221)
plot(x,asin(x)+2,"r")
title("asin(x)+2")
subplot(222)
plot(x,4.^(x).*cos(x),"b")
title("4.^(x).*cos(x)")
subplot(223)
plot(x,tan(x)+3,"k")
title('tan(x)+3,')
subplot(224)
plot(x,(3/2)*exp(x),"g")
title("(3/2)*exp(x)")