#导入课程所需要的库
#导入一个库中制定函数的一般做法:
##from (library) import(specific library function)
#导入一个库的一般做法:
##import (library) as (give the library a nickname/alias)

from pandas import DataFrame, read_csv
import matplotlib.pyplot as plt
import pandas as pd #导入pandas的常规做法
import sys #本处导入sys库只是为了确认一下python是2.X还是3.X
import matplotlib #导入matplotlib是为了显示一下版本号
#初始化matplotlib,并用inline方式显示图形
%matplotlib inline
"""
matplotlib作用
1.是在使用jupyter notebook 或者 jupyter qtconsole的时候,才会经常用到%matplotlib,也就是说那一份代码可能就是别人使用jupyter notebook 或者 jupyter qtconsole进行编辑的。
2.而%matplotlib具体作用是当你调用matplotlib.pyplot的绘图函数plot()进行绘图的时候,或者生成一个figure画布的时候,可以直接在你的python console里面生成图像。
另外,我们在spyder或者pycharm实际运行代码的时候,可以直接注释掉这一句,也是可以运行成功的。
"""
print('Python version ' + sys.version)
print('Pandas version ' + pd.__version__)
print('Matplotlib version ' + matplotlib.__version__)
Python version 3.5.4 |Continuum Analytics, Inc.| (default, Aug 14 2017, 13:41:13) [MSC v.1900 64 bit (AMD64)]
Pandas version 0.20.3
Matplotlib version 2.0.2
#建立初始数据集:婴儿名字和出生率
names = ['Bob','Jessica','Mary','John','Mel']
births = [968, 155, 77, 578, 973]
#用zip函数将这两个列表合并在一起。
"""
Init signature: zip(self, /, *args, **kwargs)
Docstring:
zip(iter1 [,iter2 [...]]) --> zip object

Return a zip object whose .__next__() method returns a tuple where
the i-th element comes from the i-th iterable argument.  The .__next__()
method continues until the shortest iterable in the argument sequence
is exhausted and then it raises StopIteration.
Type:           type
"""
BabyDataSet = list(zip(names, births))
BabyDataSet
[('Bob', 968), ('Jessica', 155), ('Mary', 77), ('John', 578), ('Mel', 973)]
"""
df 是一个DataFrame对象。
你可以把这个对象理解为包含了BabyDataset的内容而格式非常象一个sql表格或者Excel的数据表。
"""
df = pd.DataFrame(data = BabyDataSet, columns=['Names', 'Births' ])
df
Names    Births
0    Bob    968
1    Jessica    155
2    Mary    77
3    John    578
4    Mel    973
"""
将dataframe导出到一个csv文件中。
我们将导出文件命名为births1880.csv。
导出csv文件的函数是to_csv。除非你指定了其他的文件目录,否则导出的文件 将保存在和notebook文件相同的位置。

Signature: df.to_csv(path_or_buf=None, sep=',', na_rep='', float_format=None, columns=None, header=True, index=True, index_label=None, mode='w', encoding=None, compression=None, quoting=None, quotechar='"', line_terminator='\n', chunksize=None, tupleize_cols=False, date_format=None, doublequote=True, escapechar=None, decimal='.')
Docstring:
Write DataFrame to a comma-separated values (csv) file
"""
df.to_csv('births1880.csv', index=False, header=False)
#注意字符串之前的r。因为斜线(slash)是一个特殊字符,在字符串之前放置前导的 r将会把整个字符串进行转义(escape)。
Location = r'./births1880.csv'
df = pd.read_csv(Location)
df
Bob    968
0    Jessica    155
1    Mary    77
2    John    578
3    Mel    973
"""
这里出现了一个问题。read_csv函数将csv文件中的第一行作为了每列的列名 (headnames)。这明显不对,因为数据文件没有提供列名。
要修正这个错误,我们需要给read_csv函数传入header这个参数,并设置为 None(Python中null的意思)。
"""
df = pd.read_csv(Location, header=None)
df
0    1
0    Bob    968
1    Jessica    155
2    Mary    77
3    John    578
4    Mel    973
#如果我们需要为每一列指定一个名字,我们可以传入另外一个参数names,同时 去掉header这个参数。
df = pd.read_csv(Location, names=['Names', 'Births'])
df
Names    Births
0    Bob    968
1    Jessica    155
2    Mary    77
3    John    578
4    Mel    973
"""
你可以把数字[0,1,2,3,4]设想为Excel文件中的行标(row number)。在pandas 中,这些是索引(index)的一部分。你可以把索引(index)理解为一个sql表中的主 键(primary key),但是索引(index)是可以重复的。
[Names,Births]是列名,和sql表或者Excel数据表中的列名(column header)是类似的。
"""
#删除这个csv
import os
os.remove(Location)
"""
Names列是由字母和数字串组成的婴儿名字。这一列也许会出现一些脏数据但我们现在不需要有太多顾虑。
Births列应该是通过整型数字(integers)表示一个指定年份指定婴儿名字的出生率。
我们可以检查一下是否这一列的数字都是整型。这一列出现浮点型(float)是没有意义的。但我们不需要担心这一列出现任何可能的离群值(outlier)。
"""
#查看每一列的数据类型
df.dtypes
Names     object
Births     int64
dtype: object
#查看Births列的数据类型
df.Births.dtype
dtype('int64')
"""
分析数据:
找到最高出生率的婴儿名或者是最热门的婴儿名字
方法一:将dataframe排序并且找到第一行
方法二:使用max()属性找到最大值
"""
#方法一:
Sorted = df.sort_values(['Births'], ascending=False)
Sorted.head(1)
Names    Births
4    Mel    973
#方法二:
df['Births'].max()
973
#表现数据
df['Births'].plot.bar()
<matplotlib.axes._subplots.AxesSubplot at 0x26c44508148>
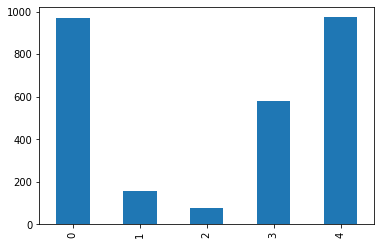
#pandas使用非常方便的plot()让你用dataframe中的数据来轻松制图。
"""
df['Names']这是完整的婴儿名字的列表,完整的Names列
df['Births']这是1880年的出生率,完整的Births列
df['Births'].max()这是Births列中的最大值
"""
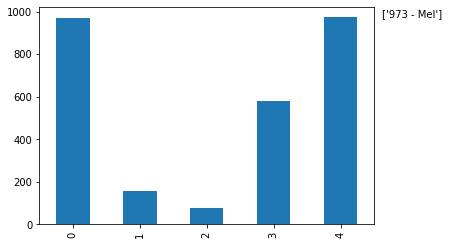
df['Births'].plot.bar()
MaxValue = df['Births'].max()
#[df['Births']==df['Births'].max()]的意思是[在Births列中找到值是 973的所有记录]
#df['Names'][df['Births']==df['Births'].max()]的意思是在Names 列中挑选出[Births列的值等于973]
MaxName = df['Names'][df['Births'] == df['Births'].max()].values
#准备要显示的文本
Text = str(MaxValue) + " - " + MaxName
#将文本显示在图形中
plt.annotate(Text, xy=(1, MaxValue), xytext=(8, 0),xycoords=('axes fraction', 'data'), textcoords='offset points')
print("The most popular name")
df[df['Births'] == df['Births'].max()]
The most popular name
Names Births
4 Mel 973