这是一篇非常非常基础的入门教程,但是也能让你深入了解pycharts的实现机制和带着你深入了解细节的设计,因此非常建议你能看完,相信一定会有所收获!
这一篇讲深入介绍饼图、仪表盘、图像和表格的基础知识。
文章目录
一、饼图
(一)导入通用模块包。
from pyecharts.charts import Page,Pie
from pyecharts.commons.utils import JsCode
from pyecharts.faker import Faker
from pyecharts import options as opts
(二)查看类的函数
可以通过help(Pie)命令查看,相应的类为:class pyecharts.charts.Pie
class Pie(
    # 初始化配置项,参考 `global_options.InitOpts`
    init_opts: opts.InitOpts = opts.InitOpts()
)
func pyecharts.charts.Pie.add
def add(
    # 系列名称,用于 tooltip 的显示,legend 的图例筛选。
    series_name: str,

    # 系列数据项,格式为 [(key1, value1), (key2, value2)]
    data_pair: Sequence,

    # 系列 label 颜色
    color: Optional[str] = None,

    # 饼图的半径,数组的第一项是内半径,第二项是外半径
    # 默认设置成百分比,相对于容器高宽中较小的一项的一半
    radius: Optional[Sequence] = None,

    # 饼图的中心(圆心)坐标,数组的第一项是横坐标,第二项是纵坐标
    # 默认设置成百分比,设置成百分比时第一项是相对于容器宽度,第二项是相对于容器高度
    center: Optional[Sequence] = None,

    # 是否展示成南丁格尔图,通过半径区分数据大小,有'radius'和'area'两种模式。
    # radius:扇区圆心角展现数据的百分比,半径展现数据的大小
    # area:所有扇区圆心角相同,仅通过半径展现数据大小
    rosetype: Optional[str] = None,

    # 饼图的扇区是否是顺时针排布。
    is_clockwise: bool = True,

    # 标签配置项,参考 `series_options.LabelOpts`
    label_opts: Union[opts.LabelOpts, dict] = opts.LabelOpts(),

    # 提示框组件配置项,参考 `series_options.TooltipOpts`
    tooltip_opts: Union[opts.TooltipOpts, dict, None] = None,

    # 图元样式配置项,参考 `series_options.ItemStyleOpts`
    itemstyle_opts: Union[opts.ItemStyleOpts, dict, None] = None,
)
(三)相关重要函数
# Pie()
# init_opts初始化配置,page_title设置网页标题,bg_color设置画板背景颜色
Pie(init_opts=opts.InitOpts(page_title='我的饼图',bg_color='yellow'))

# 可以有多个add,通过设置center来定位饼图的位置。
.add(
"", #设置系列名称
[list(z)for z in zip(Faker.choose(),Faker.values())], #设置数据源
center=["65%", "0%"],# 调整饼图圆心位置,第一个参数水平位置,第2个参数设置垂直位置
radius=["100%","10%"],# radius第一个外半径,第2个参数内半径
rosetype="radius",# 设置成玫瑰图,值只有2种,radius和area
radius:10% # 扇区圆心角展现数据的百分比,
# rosetype="area",# area:所有扇区圆心角相同,半径展现数据大小
)

# set_colors设置颜色,可以用列表形式
.set_colors(["black","orange","green","yellow","red","pink","red"])

# set_global_opts()
.set_global_opts(
title_opts=opts.TitleOpts(title="Pie-基本示例"), #设置标题
legend_opts=opts.LegendOpts(
            type_="scroll", # 设置成滚动模式
            orient="vertical",pos_top="15%",pos_left="2%"
            # orient="vertical"设置图例垂直
            ,pos_bottom="0%"), #图例调到最底部

# set_series_opts()
# formatter 饼图、仪表盘、漏斗图: {a}(系列名称),{b}(数据项名称),{c}(数值), {d}(百分比)
.set_series_opts(label_opts=opts.LabelOpts(formatter="{b}:{c}"))
#渲染成html网页
render()
(四)第一个案例
from pyecharts.charts import Pie

x_data = ["高中", "大专", "本科", "硕士", "博士"]
y_data = [335, 310, 274, 235, 400]
bar = (
    Pie()
    .add(
        series_name="学历",
        data_pair=[list(z) for z in zip(x_data, y_data)],
        center=["50%","50%"],
    )
    .render("templates\index.html")
)

(五)设置背景色和标题、宽度和高度
from pyecharts.charts import Pie
from pyecharts import options as opts

x_data = ["高中", "大专", "本科", "硕士", "博士"]
y_data = [335, 310, 274, 235, 400]

bar = (
    # Pie()
    Pie(init_opts=opts.InitOpts(page_title='我的饼图',bg_color='pink',width="500px",height="400px"))
    .add(
        series_name="学历",
        data_pair=[list(z) for z in zip(x_data, y_data)],
        center=["50%","50%"],
    )
    .render("templates\index.html")
)

(六)设置图例显示位置
from pyecharts.charts import Pie
from pyecharts import options as opts

x_data = ["高中", "大专", "本科", "硕士", "博士"]
y_data = [335, 310, 274, 235, 400]

bar = (
    # Pie()
    Pie(init_opts=opts.InitOpts(page_title='我的饼图',bg_color='pink',width="500px",height="400px"))
    .add(
        series_name="学历",
        data_pair=[list(z) for z in zip(x_data, y_data)],
        center=["50%","50%"],
    )
    .set_global_opts(
        title_opts=opts.TitleOpts(title="我的饼图"),
        legend_opts=opts.LegendOpts(pos_left="left", orient="vertical",pos_top="10%"),

    )
    .render("templates\index.html")
)

(七)设置数值显示格式
from pyecharts.charts import Pie
from pyecharts import options as opts

x_data = ["高中", "大专", "本科", "硕士", "博士"]
y_data = [335, 310, 274, 235, 400]

bar = (
    # Pie()
    Pie(init_opts=opts.InitOpts(page_title='我的饼图',bg_color='pink',width="500px",height="400px"))
    .add(
        series_name="学历",
        data_pair=[list(z) for z in zip(x_data, y_data)],
        center=["50%","50%"],
    )
    .set_global_opts(
        title_opts=opts.TitleOpts(title="我的饼图"),
        legend_opts=opts.LegendOpts(pos_left="left", orient="vertical",pos_top="10%"),
    )
    .set_series_opts(
        label_opts=opts.LabelOpts(formatter="{b}:{c}")
    )

    .render("templates\index.html")
)

(八)自定义颜色显示
from pyecharts.charts import Pie
from pyecharts import options as opts

x_data = ["高中", "大专", "本科", "硕士", "博士"]
y_data = [335, 310, 274, 235, 400]

bar = (
    # Pie()
    Pie(init_opts=opts.InitOpts(page_title='我的饼图',bg_color='pink',width="500px",height="400px"))
    .add(
        series_name="学历",
        data_pair=[list(z) for z in zip(x_data, y_data)],
        center=["50%","50%"],
    )
    .set_colors(["blue", "green", "yellow", "red", "orange"])
    .set_global_opts(
        title_opts=opts.TitleOpts(title="我的饼图"),
        legend_opts=opts.LegendOpts(pos_left="left", orient="vertical",pos_top="10%"),
    )
    .set_series_opts(
        label_opts=opts.LabelOpts(formatter="{b}:{c}")
    )

    .render("templates\index.html")
)

(九)设置标题的颜色和位置居中
from pyecharts.charts import Pie
from pyecharts import options as opts

x_data = ["高中", "大专", "本科", "硕士", "博士"]
y_data = [335, 310, 274, 235, 400]

bar = (
    # Pie()
    Pie(init_opts=opts.InitOpts(page_title='我的饼图',bg_color='pink',width="500px",height="400px"))
    .add(
        series_name="学历",
        data_pair=[list(z) for z in zip(x_data, y_data)],
        center=["50%","50%"],
    )
    .set_colors(["blue", "green", "yellow", "red", "orange"])
    .set_global_opts(
        title_opts=opts.TitleOpts(title="我的饼图",pos_left='center',title_textstyle_opts=opts.TextStyleOpts(color="#ff0")),
        legend_opts=opts.LegendOpts(pos_left="left", orient="vertical",pos_top="10%"),
    )
    .set_series_opts(
        label_opts=opts.LabelOpts(formatter="{b}:{c}")
    )
    .render("templates\index.html")
)

(十)设置成玫瑰图
from pyecharts.charts import Pie
from pyecharts import options as opts

x_data = ["高中", "大专", "本科", "硕士", "博士"]
y_data = [335, 310, 274, 235, 400]

bar = (
    # Pie()
    Pie(init_opts=opts.InitOpts(page_title='我的饼图',bg_color='pink',width="500px",height="400px"))
    .add(
        series_name="学历",
        data_pair=[list(z) for z in zip(x_data, y_data)],
        center=["50%","50%"],
        rosetype="radius",# 设置成玫瑰图,值只有2种,radius和area
        # radius="100%" # 扇区圆心角展现数据的百分比,
    )
    .set_colors(["blue", "green", "yellow", "red", "orange"])
    .set_global_opts(
        title_opts=opts.TitleOpts(title="我的饼图",pos_left='center',title_textstyle_opts=opts.TextStyleOpts(color="#ff0")),
        legend_opts=opts.LegendOpts(pos_left="left", orient="vertical",pos_top="10%"),
    )
    .set_series_opts(
        label_opts=opts.LabelOpts(formatter="{b}:{c}")
    )
    .render("templates\index.html")
)

(十一)圆环显示
from pyecharts.charts import Pie
from pyecharts import options as opts

x_data = ["高中", "大专", "本科", "硕士", "博士"]
y_data = [335, 310, 274, 235, 400]

bar = (
    # Pie()
    Pie(init_opts=opts.InitOpts(page_title='我的饼图',bg_color='pink',width="500px",height="400px"))
    .add(
        series_name="学历",
        data_pair=[list(z) for z in zip(x_data, y_data)],
        center=["50%","50%"],
        radius=["40%","60%"],
        # rosetype="radius",# 设置成玫瑰图,值只有2种,radius和area
        # radius="100%" # 扇区圆心角展现数据的百分比,
    )
    .set_colors(["blue", "green", "yellow", "red", "orange"])
    .set_global_opts(
        title_opts=opts.TitleOpts(title="我的饼图",pos_left='center',title_textstyle_opts=opts.TextStyleOpts(color="#ff0")),
        legend_opts=opts.LegendOpts(pos_left="left", orient="vertical",pos_top="10%"),
    )
    .set_series_opts(
        label_opts=opts.LabelOpts(formatter="{b}:{c}")
    )
    .render("templates\index.html")
)

(十二)设置成多图
from pyecharts.charts import Pie
from pyecharts import options as opts

x_data = ["高中", "大专", "本科", "硕士", "博士"]
y_data = [335, 310, 274, 235, 400]

bar = (
    # Pie()
    Pie(init_opts=opts.InitOpts(page_title='我的饼图',bg_color='pink',width="600px",height="400px"))
    .add(
        series_name="学历",
        data_pair=[list(z) for z in zip(x_data, y_data)],
        center=["20%","50%"],
        radius=[60,100],
    )
    .add(
        series_name="学历2",
        data_pair=[list(z) for z in zip(x_data, y_data)],
        center=["70%", "50%"],
        radius=100
    )
    .set_colors(["blue", "green", "yellow", "red", "orange"])
    .set_global_opts(
        title_opts=opts.TitleOpts(title="我的饼图",pos_left='center',title_textstyle_opts=opts.TextStyleOpts(color="#ff0")),
        legend_opts=opts.LegendOpts(pos_left="left", orient="vertical"),
    )
    .set_series_opts(
        label_opts=opts.LabelOpts(formatter="{b}:{c}")
    )
    .render("templates\index.html")
)

二、仪表盘
(一)导入相应的包
import pyecharts.options as opts
from pyecharts.charts import Gauge,Pie
(二)查看类的函数
可以通过help(Gauge)命令查看,相应的类为:pyecharts.charts.Gauge
class Gauge(
    # 初始化配置项,参考 `global_options.InitOpts`
    init_opts: opts.InitOpts = opts.InitOpts()
)
func pyecharts.charts.Gauge.add
def add(
    # 系列名称,用于 tooltip 的显示,legend 的图例筛选。
    series_name: str,

    # 系列数据项,格式为 [(key1, value1), (key2, value2)]
    data_pair: Sequence,

    # 是否选中图例
    is_selected: bool = True,

    # 最小的数据值
    min_: Numeric = 0,

    # 最大的数据值
    max_: Numeric = 100,

    # 仪表盘平均分割段数
    split_number: Numeric = 10,

    # 仪表盘起始角度。圆心 正右手侧为0度,正上方为 90 度,正左手侧为 180 度。
    start_angle: Numeric = 225,

    # 仪表盘结束角度。
    end_angle: Numeric = -45,

    # 轮盘内标题文本项标签配置项,参考 `series_options.LabelOpts`
    title_label_opts: Union[opts.LabelOpts, dict] = opts.LabelOpts(),

    # 轮盘内数据项标签配置项,参考 `series_options.LabelOpts`
    detail_label_opts: Union[opts.LabelOpts, dict] = opts.LabelOpts(),

    # 提示框组件配置项,参考 `series_options.TooltipOpts`
    tooltip_opts: Union[opts.TooltipOpts, dict, None] = None,

    # 图元样式配置项,参考 `series_options.ItemStyleOpts`
    itemstyle_opts: Union[opts.ItemStyleOpts, dict, None] = None,
)
(三)相关重要函数
Gauge()
.add(series_name="业务指标", data_pair=[["完成率", 55.5]])
.set_global_opts()
.set_series_opts()
.render("templates\index.html")
(四)第一个案例
import pyecharts.options as opts
from pyecharts.charts import Gauge,Pie
gau = (
    Gauge(init_opts=opts.InitOpts(width="500px", height="400px"))
    .add(series_name="我的仪表盘", data_pair=[["成功率", 85.5]])
    .render("templates\index.html")
)

(五)修改字体颜色
import pyecharts.options as opts
from pyecharts.charts import Gauge
gau = (
    Gauge(init_opts=opts.InitOpts(width="500px", height="400px"))
    .add(
        series_name="我的仪表盘",
        data_pair=[["成功率", 85.5]],
        label_opts=opts.LabelOpts(font_size=40, color="blue", font_family="Microsoft YaHei")
        )
    .render("templates\index.html")
)

(六)修改仪表盘颜色
import pyecharts.options as opts
from pyecharts.charts import Gauge
gau = (
    Gauge(init_opts=opts.InitOpts(width="500px", height="400px"))
    .add(
        series_name="我的仪表盘",
        data_pair=[["成功率", 85.5]],
        label_opts=opts.LabelOpts(font_size=40, color="blue", font_family="Microsoft YaHei"),
        axisline_opts=opts.AxisLineOpts(
            linestyle_opts=opts.LineStyleOpts(
                color=[(0.3, "#67e0e3"), (0.7, "#37a2da"), (1, "#fd666d")], width=30
            )
        ),
        )
    .render("templates\index.html")
)

三、图片显示
from pyecharts.components import Image
from pyecharts.options import ComponentTitleOpts

image = Image()
img_src = ("static\\bar.png")
image.add(
    src=img_src,
    style_opts={"width": "500px", "height": "300px", "style": "margin-top: 20px"},
)
image.set_global_opts(
    title_opts=ComponentTitleOpts(title="我的Image", subtitle="我是副标题")
)
image.render("templates\index.html")

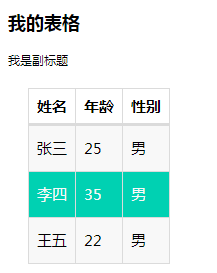
四、表格显示
from pyecharts.components import Table
from pyecharts.options import ComponentTitleOpts

table = Table()

headers = ["姓名", "年龄", "性别"]
rows = [["张三", 25, '男'],
    ["李四", 35, '男'],
    ["王五", 22, '男'],
]
table.add(headers, rows)
table.set_global_opts(
    title_opts=ComponentTitleOpts(title="我的表格", subtitle="我是副标题")
)
table.render("templates\index.html")

OK,终于写完了,后续我将会继续介绍常见的组合图形的实现方式,敬请期待。
感谢你的关注!
参考:https://pyecharts.org/#/zh-cn/intro
