本程序基于百度飞浆 PaddlePaddle 平台完成。
该程序通过DeepLabv3+模型完成一键抠图。
encoder-decoder进行多尺度信息的融合,同时保留了原来的空洞卷积和ASSP层, 其骨干网络使用了Xception模型,提高了语义分割的健壮性和运行速率,在 PASCAL VOC 2012 dataset取得新的state-of-art performance,该PaddleHub Module使用百度自建数据集进行训练,可用于人像分割,支持任意大小的图片输入。
在完成一键抠图之后,通过图像合成,实现有趣的应用!
程序实现
首先安装 paddlehub
!pip install paddlehub==1.6.0 -i https://pypi.tuna.tsinghua.edu.cn/simple
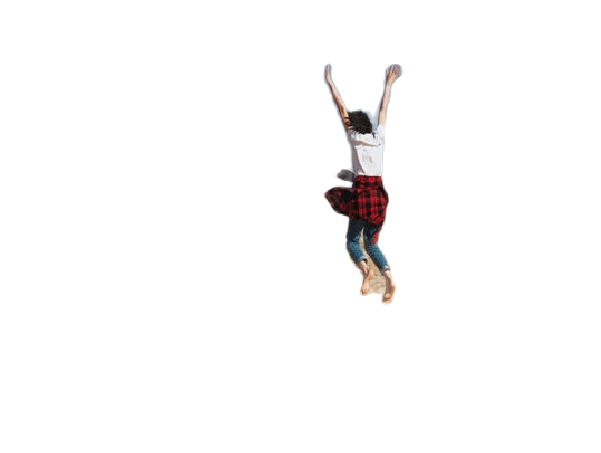
然后查看下我要要抠图的目标文件
# 待预测图片
img_name = 'ty.jpg'
test_img_path = ["./"+img_name]
#test_img_path = ["./meditation.jpg"]


import matplotlib.pyplot as plt
import matplotlib.image as mpimg

img = mpimg.imread(test_img_path[0])

# 展示待预测图片
plt.figure(figsize=(10,10))
plt.imshow(img)
plt.axis('off')
plt.show()

通过加载PaddleHub DeepLabv3+模型(deeplabv3p_xception65_humanseg)实现一键抠图
import paddlehub as hub

module = hub.Module(name="deeplabv3p_xception65_humanseg")

input_dict = {"image": test_img_path}

# execute predict and print the result
results = module.segmentation(data=input_dict)
for result in results:
    print(result)

# 预测结果展示
test_img_path = "./humanseg_output/"+img_name.split('.')[0]+'.png'
img = mpimg.imread(test_img_path)
plt.figure(figsize=(10,10))
plt.imshow(img)
plt.axis('off')
plt.show()
将抠出的人物图片合成在想要的背景图片当中。
from PIL import Image
import numpy as np

def blend_images(fore_image, base_image, img_num):
#def blend_images(fore_image, base_image):
    """
    将抠出的人物图像换背景
    fore_image: 前景图片,抠出的人物图片
    base_image: 背景图片
    """
    # 读入图片
    base_image = Image.open(base_image).convert('RGB')
    fore_image = Image.open(fore_image).resize(base_image.size)

    # 图片加权合成
    scope_map = np.array(fore_image)[:,:,-1] / 255
    scope_map = scope_map[:,:,np.newaxis]
    scope_map = np.repeat(scope_map, repeats=3, axis=2)
    res_image = np.multiply(scope_map, np.array(fore_image)[:,:,:3]) + np.multiply((1-scope_map), np.array(base_image))

    #保存图片
    res_image = Image.fromarray(np.uint8(res_image))
    res_image.save('./humanseg_output/'+str(img_num)+".jpg")
根据需要运行合成程序
# 合成几张图片
img_num = 4

for i in range(img_num):
    blend_images('./humanseg_output/'+img_name.split('.')[0]+'.png', str(i+1)+'.jpg', i+1)

# 展示合成图片
plt.figure(figsize=(10,10))
for i in range(img_num):
    plt.subplot(2,2,i+1)
    img = mpimg.imread('./humanseg_output/'+str(i+1)+".jpg")
    plt.imshow(img)
    plt.axis('off')
plt.show()

欢迎大家用AI环游世界!
