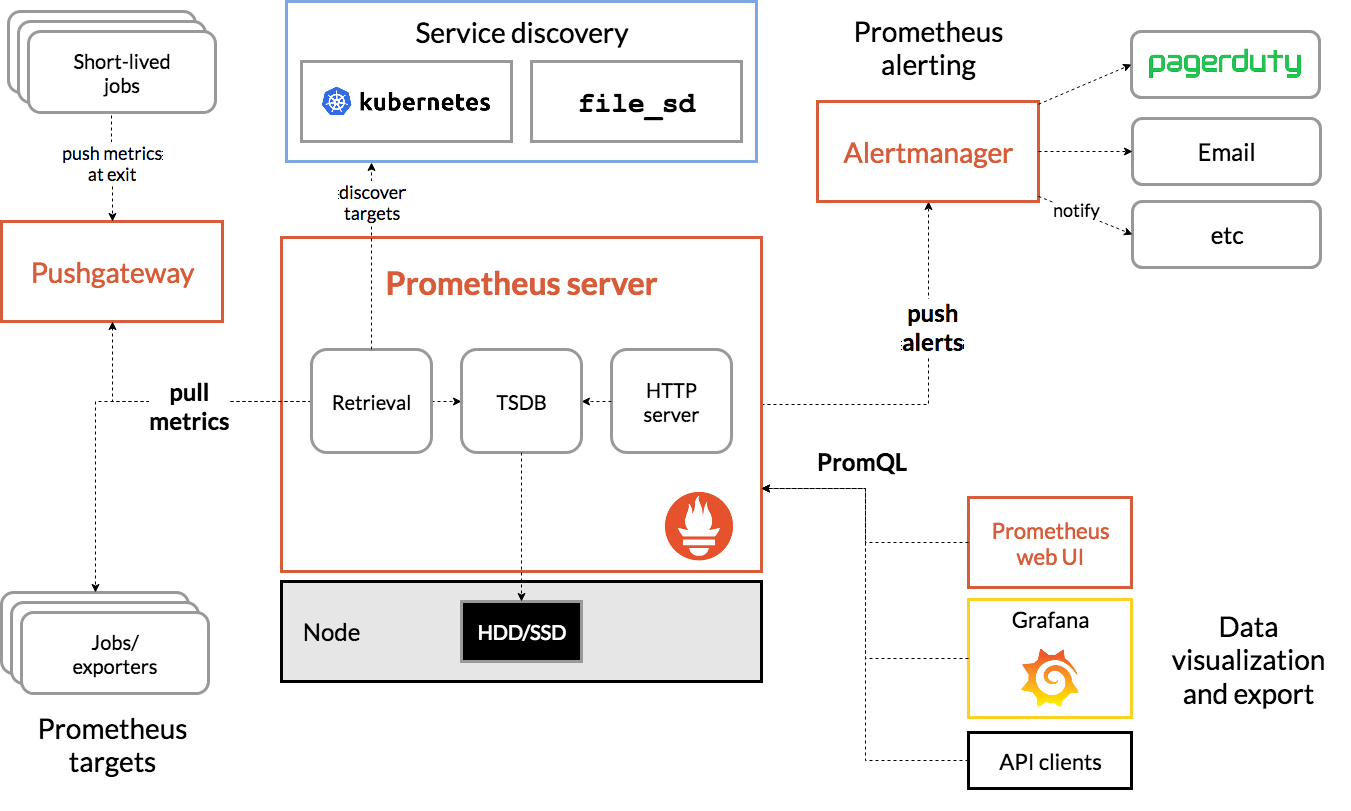
组件介绍:
| 组件介绍 | 功能 |
| Prometheus Server | 主要用于抓取数据和存储时序数据,另外还提供查询和 Alert Rule 配置管理。 |
| client libraries | 用于对接 Prometheus Server,可以查询和上报数据。 |
| push gateway | 用于批量,短期的监控数据的汇总节点,主要用于用于业务数据汇报等。 |
| exporters | 用来汇报数据,列如汇报机器数据的node_exporter,汇报 MongDB 信息的 MongDB exporter 等等 |
| altertmanager |
我们的监控节点使用docker起镜像,Prometheus使用二进制安装
地址规划:
| ip地址 | 角色 | 组件 | |
| docker01 | 10.0.0.11 | 客户端 | node_exporter cadvisor |
| docker02 | 10.0.0.12 | 客户端 | node_exporter cadvisor |
| docker03 | 10.0.0.13 | 服务端 |
node_exporter组件地址:https://github.com/prometheus/node_exporter
cadvisor组件地址:https://github.com/google/cadvisor
# pull镜像
docker pull google/cadvisor:latest   <---监控容器
docker pull prom/node-exporter       <---监控硬件
# 启动node-exporter和启动cadvisor
docker run -d   -p 9100:9100   -v "/:/host:ro,rslave"   --name=node_exporter   quay.io/prometheus/node-exporter   --path.rootfs /host

docker run --volume=/:/rootfs:ro  --volume=/var/run:/var/run:rw --volume=/sys:/sys:ro --volume=/var/lib/docker/:/var/lib/docker:ro  --publish=8080:8080 --detach=true --name=cadvisor google/cadvisor:latest
服务端:
下载地址:https://prometheus.io/download/
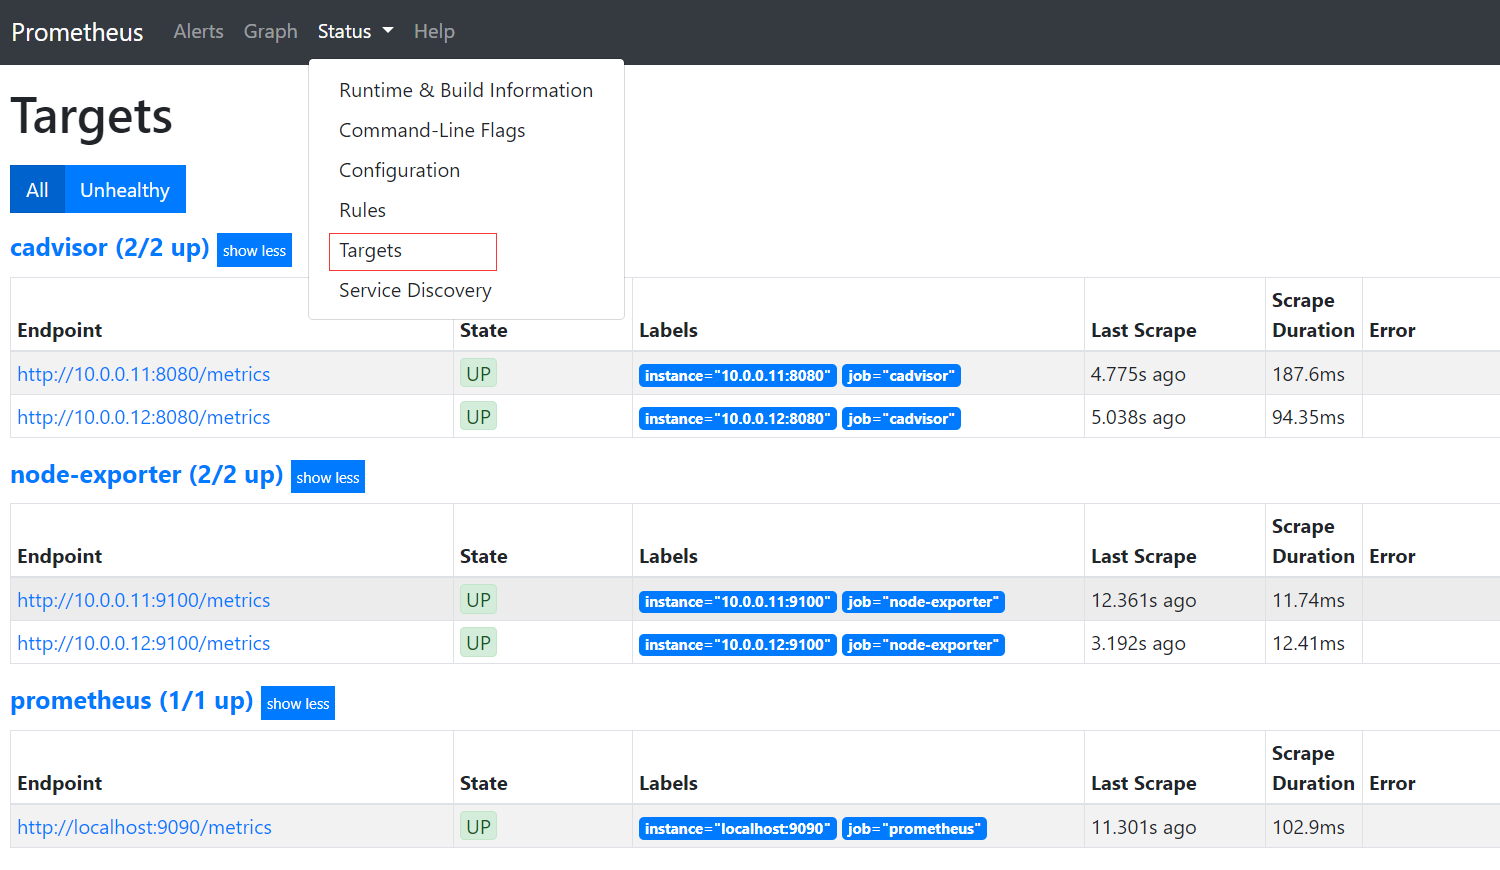
# 安装Prometheus
wget https://github.com/prometheus/prometheus/releases/download/v2.17.1/prometheus-2.17.1.linux-amd64.tar.gz
tar xf prometheus-2.17.1.linux-amd64.tar.gz

[root@docker03 prometheus-2.17.1.linux-amd64]# ls
console_libraries  consoles  LICENSE  NOTICE  prometheus  prometheus.yml  promtool  tsdb

# 配置文件内容
cat prometheus.yml
# my global config
global:
  #每15s采集一次数据
  scrape_interval:     15s # Set the scrape interval to every 15 seconds. Default is every 1 minute.
  #每15s做一次告警测试
  evaluation_interval: 15s # Evaluate rules every 15 seconds. The default is every 1 minute.
  # scrape_timeout is set to the global default (10s).

# Alertmanager configuration
alerting:
  alertmanagers:
  - static_configs:
    - targets:
      # - alertmanager:9093

# Load rules once and periodically evaluate them according to the global 'evaluation_interval'.
rule_files:
  # - "first_rules.yml"
  # - "second_rules.yml"

# A scrape configuration containing exactly one endpoint to scrape:
# Here it's Prometheus itself.
scrape_configs:
  # The job name is added as a label `job=<job_name>` to any timeseries scraped from this config.
    #静态的指定一个监控目标
  - job_name: 'prometheus'
    static_configs:
    - targets: ['localhost:9090']
  - job_name: 'node-exporter'
    static_configs:
    - targets: ['10.0.0.11:9100','10.0.0.12:9100']
  - job_name: 'node-exporter'
    static_configs:
    - targets: ['10.0.0.11:8080','10.0.0.12:8080']


### 启动容器
./prometheus --config.file="prometheus.yml"
### 登录Prometheus:ip:9090
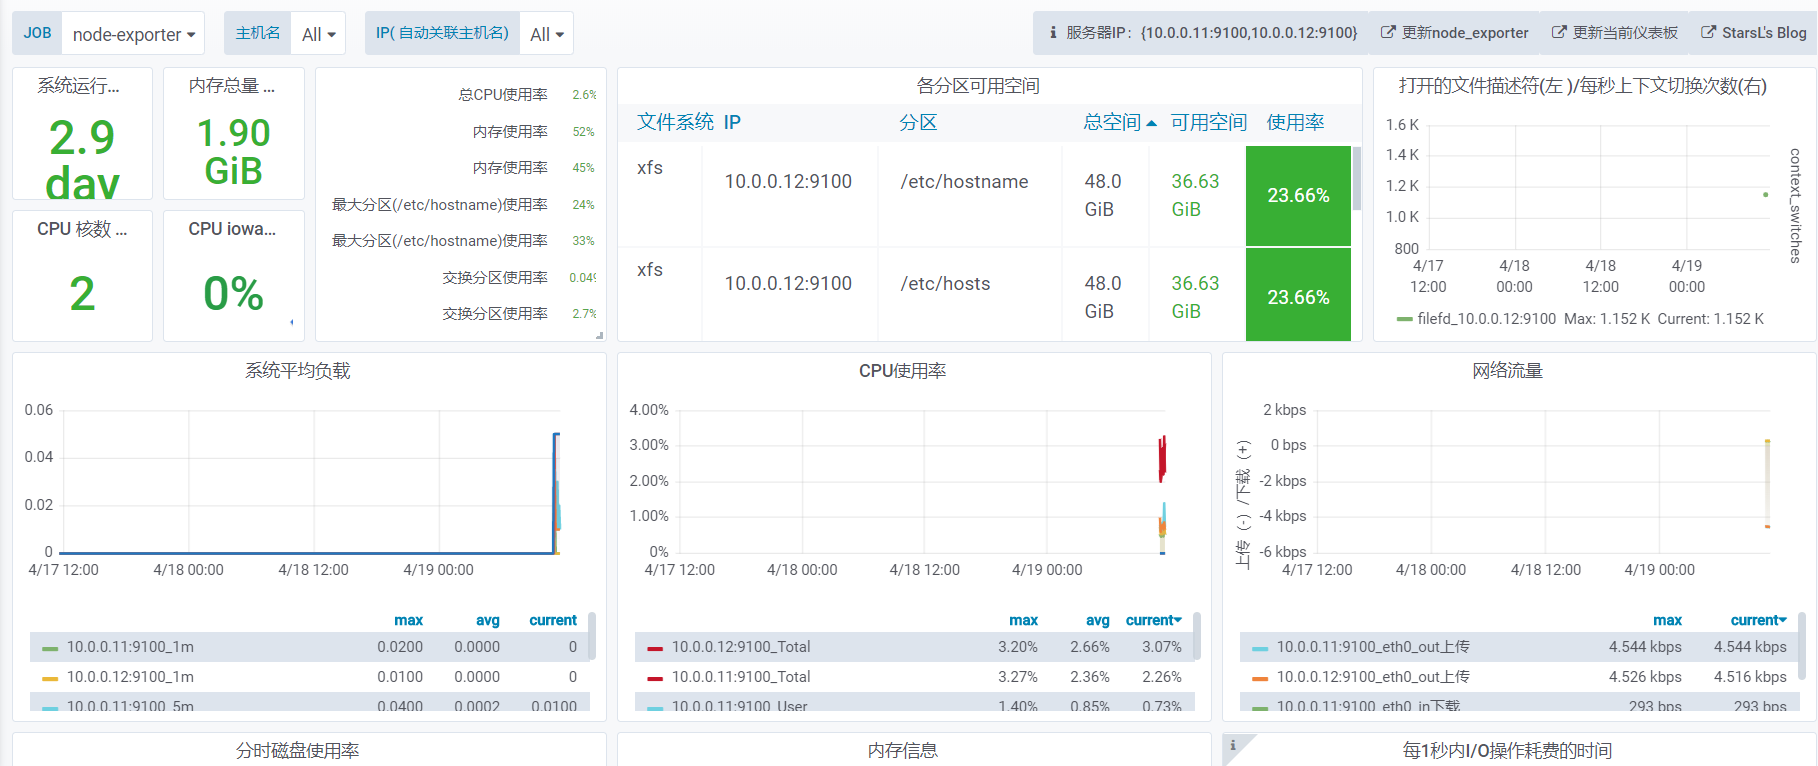
页面:
扫描二维码关注公众号,回复:
10946174 查看本文章

# 下载rpm包
wget https://mirrors.tuna.tsinghua.edu.cn/grafana/yum/rpm/grafana-6.7.2-1.x86_64.rpm
yum install grafana-6.7.2-1.x86_64.rpm -y

# 启动grafana
systemctl start grafana-server.service
systemctl enable grafana-server.service
# 访问
登录 ip:3000 端口
页面:

点击image选择添加模板,然后点击要监控的数据源,最后出图显示: