Task4建模调参
review
在上一部分的分析中,我们得出想要按照隐藏类别构建两个模型进行预测的结论,构建了新的类别特征,并且后续我又做了些工作进行了数据处理,归一化,得到了用于训练树模型的和线性模型的数据。
建模
载入包
import pandas as pd
import numpy as np
import warnings
warnings.filterwarnings('ignore')
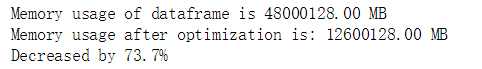
减少数据占用的内存
def reduce_mem_usage(df):
    """ iterate through all the columns of a dataframe and modify the data type
        to reduce memory usage.
    """
    start_mem = df.memory_usage().sum()
    print('Memory usage of dataframe is {:.2f} MB'.format(start_mem))

    for col in df.columns:
        col_type = df[col].dtype

        if col_type != object:
            c_min = df[col].min()
            c_max = df[col].max()
            if str(col_type)[:3] == 'int':
                if c_min > np.iinfo(np.int8).min and c_max < np.iinfo(np.int8).max:
                    df[col] = df[col].astype(np.int8)
                elif c_min > np.iinfo(np.int16).min and c_max < np.iinfo(np.int16).max:
                    df[col] = df[col].astype(np.int16)
                elif c_min > np.iinfo(np.int32).min and c_max < np.iinfo(np.int32).max:
                    df[col] = df[col].astype(np.int32)
                elif c_min > np.iinfo(np.int64).min and c_max < np.iinfo(np.int64).max:
                    df[col] = df[col].astype(np.int64)
            else:
                if c_min > np.finfo(np.float16).min and c_max < np.finfo(np.float16).max:
                    df[col] = df[col].astype(np.float16)
                elif c_min > np.finfo(np.float32).min and c_max < np.finfo(np.float32).max:
                    df[col] = df[col].astype(np.float32)
                else:
                    df[col] = df[col].astype(np.float64)
        else:
            df[col] = df[col].astype('category')

    end_mem = df.memory_usage().sum()
    print('Memory usage after optimization is: {:.2f} MB'.format(end_mem))
    print('Decreased by {:.1f}%'.format(100 * (start_mem - end_mem) / start_mem))
    return df
导入数据
sample_feature = reduce_mem_usage(pd.read_csv('data_for_tree_seperate.csv'))
选择部分参与训练的特征,便于下一步使用
continuous_feature_names = [x for x in sample_feature.columns if x not in ['price','brand','model','brand','v2_bin']]
为了按照v2_bin构建两个模型,我们需要划分出两个训练集
在给出的例子中,删去了所有具有缺失值的数据,这有两个目的:一是训练集的数据一定是不具有price的,这样就把测试集排除了;二是删去其余属性具有缺失值的数据,便于训练。在这里我根据v2_bin的值划分出两个训练集。
但是我在执行的时候发生了一些问题,因为第二类的数据恰好在某个属性上都有缺失值,导致删去缺失值后不存在第二类的数据,所以我只好在第二类分类器的训练中放弃使用一些属性值
sample_feature = sample_feature.replace('-', 0).reset_index(drop=True)
sample_feature['notRepairedDamage'] = sample_feature['notRepairedDamage'].astype(np.float32)
train = sample_feature[continuous_feature_names + ['price','v2_bin']]
train_0=train[(train['v2_bin']==0)]
train_0=train_0.dropna().reset_index(drop=True)
train_1=train[(train['v2_bin']!=0)]
del train_1["bodyType"]
del train_1['fuelType']
del train_1['gearbox']
del train_1['used_time']
del train_1['city']
train_1=train_1.dropna().reset_index(drop=True)
train_X_0 = train_0[continuous_feature_names]
train_y_0 = train_0['price']
train_X_1 = train_1[[x for x in train_1.columns if x not in ['price','v2_bin']]]
train_y_1 = train_1['price']
简单建模
from sklearn.linear_model import LinearRegression
model_0 = LinearRegression(normalize=True)
model_1 = LinearRegression(normalize=True)
model_0 = model_0.fit(train_X_0, train_y_0)
model_1 = model_1.fit(train_X_1, train_y_1)
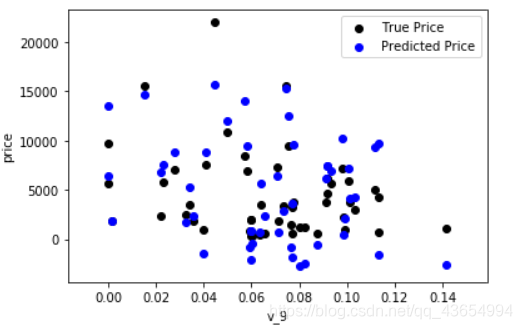
观察预测情况
from matplotlib import pyplot as plt
subsample_index = np.random.randint(low=0, high=len(train_y_0), size=50)
plt.scatter(train_X_0['v_9'][subsample_index], train_y_0[subsample_index], color='black')
plt.scatter(train_X_0['v_9'][subsample_index], model_0.predict(train_X_0.loc[subsample_index]), color='blue')
plt.xlabel('v_9')
plt.ylabel('price')
plt.legend(['True Price','Predicted Price'],loc='upper right')
print('The predicted price is obvious different from true price')
plt.show()
subsample_index = np.random.randint(low=0, high=len(train_y_1), size=50)
plt.scatter(train_X_1['v_9'][subsample_index], train_y_1[subsample_index], color='black')
plt.scatter(train_X_1['v_9'][subsample_index], model_1.predict(train_X_1.loc[subsample_index]), color='blue')
plt.xlabel('v_9')
plt.ylabel('price')
plt.legend(['True Price','Predicted Price'],loc='upper right')
print('The predicted price is obvious different from true price')
plt.show()

可以看到预测效果并不是很理想,这是因为大部分机器学习模型都要求数据呈正态分布,而我们的price属性呈长尾分布
将price取对数重新训练并预测
train_y_0_ln = np.log(train_y_0 + 1)
train_y_1_ln = np.log(train_y_1 + 1)
model_0 = model_0.fit(train_X_0, train_y_0_ln)
model_1 = model_1.fit(train_X_1, train_y_1_ln)
plt.scatter(train_X_0['v_9'][subsample_index], train_y_0[subsample_index], color='black')
plt.scatter(train_X_0['v_9'][subsample_index], np.exp(model_0.predict(train_X_0.loc[subsample_index])), color='blue')
plt.xlabel('v_9')
plt.ylabel('price')
plt.legend(['True Price','Predicted Price'],loc='upper right')
print('The predicted price seems normal after np.log transforming')
plt.show()

plt.scatter(train_X_1['v_9'][subsample_index], train_y_1[subsample_index], color='black')
plt.scatter(train_X_1['v_9'][subsample_index], np.exp(model_1.predict(train_X_1.loc[subsample_index])), color='blue')
plt.xlabel('v_9')
plt.ylabel('price')
plt.legend(['True Price','Predicted Price'],loc='upper right')
print('The predicted price seems normal after np.log transforming')
plt.show()

可以看到训练效果有所好转
交叉验证
from sklearn.model_selection import cross_val_score
from sklearn.metrics import mean_absolute_error,  make_scorer
def log_transfer(func):
    def wrapper(y, yhat):
        result = func(np.log(y), np.nan_to_num(np.log(yhat)))
        return result
    return wrapper
scores_1 = cross_val_score(model_1, X=train_X_1, y=train_y_1, verbose=1, cv = 5, scoring=make_scorer(log_transfer(mean_absolute_error)))
scores_0 = cross_val_score(model_0, X=train_X_0, y=train_y_0, verbose=0, cv = 5, scoring=make_scorer(log_transfer(mean_absolute_error)))
print('AVG:', np.mean(scores_1))
scores_1 = pd.DataFrame(scores_1.reshape(1,-1))
scores_1.columns = ['cv' + str(x) for x in range(1, 6)]
scores_1.index = ['MAE']
scores_1

print('AVG:', np.mean(scores_0))
scores_0 = pd.DataFrame(scores_0.reshape(1,-1))
scores_0.columns = ['cv' + str(x) for x in range(1, 6)]
scores_0.index = ['MAE']
scores_0

绘制曲线
from sklearn.model_selection import learning_curve, validation_curve
? learning_curve
def plot_learning_curve(estimator, title, X, y, ylim=None, cv=None,n_jobs=1, train_size=np.linspace(.1, 1.0, 5 )):
    plt.figure()
    plt.title(title)
    if ylim is not None:
        plt.ylim(*ylim)
    plt.xlabel('Training example')
    plt.ylabel('score')
    train_sizes, train_scores, test_scores = learning_curve(estimator, X, y, cv=cv, n_jobs=n_jobs, train_sizes=train_size, scoring = make_scorer(mean_absolute_error))
    train_scores_mean = np.mean(train_scores, axis=1)
    train_scores_std = np.std(train_scores, axis=1)
    test_scores_mean = np.mean(test_scores, axis=1)
    test_scores_std = np.std(test_scores, axis=1)
    plt.grid()#区域
    plt.fill_between(train_sizes, train_scores_mean - train_scores_std,
                     train_scores_mean + train_scores_std, alpha=0.1,
                     color="r")
    plt.fill_between(train_sizes, test_scores_mean - test_scores_std,
                     test_scores_mean + test_scores_std, alpha=0.1,
                     color="g")
    plt.plot(train_sizes, train_scores_mean, 'o-', color='r',
             label="Training score")
    plt.plot(train_sizes, test_scores_mean,'o-',color="g",
             label="Cross-validation score")
    plt.legend(loc="best")
    return plt
plot_learning_curve(LinearRegression(), 'Liner_model', train_X_0[:1000], train_y_0_ln[:1000], ylim=(0.0, 0.5), cv=5, n_jobs=1)

plot_learning_curve(LinearRegression(), 'Liner_model', train_X_1[:1000], train_y_1_ln[:1000], ylim=(0.0, 0.5), cv=5, n_jobs=1)

嵌入式特征选择
from sklearn.linear_model import LinearRegression
from sklearn.linear_model import Ridge
from sklearn.linear_model import Lasso
models = [LinearRegression(),
          Ridge(),
          Lasso()]
result = dict()
for model in models:
    model_name = str(model).split('(')[0]
    scores = cross_val_score(model, X=train_X_0, y=train_y_0_ln, verbose=0, cv = 5, scoring=make_scorer(mean_absolute_error))
    result[model_name] = scores
    print(model_name + ' is finished')
效果最好的是LinearRegression,特征选择如下:

