目录
1. 可视化二维矩阵的数值
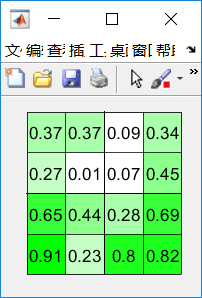
function pcolorMat(mat,ncolor,ndigits)
% PCOLORMAT allows you to visualize the matrix with color gradient
%
% USAGE:
%
% pcolorMat(mat,ncolor,ndigits)
%
% INPUT:
% - mat: The matrix you want to visualize
% - ncolor: number of color gradient
% - ndigits: number of decimal digits shown in the figure.
%
% OUTPUT:
%
% EXAMPLES:
% pcolorMat(rand(4,4))
% pcolorMat(rand(4,4),4)
%
% Copyright 2015. Zhang (Frank) Cheng ([email protected]
% v:1.0 22 May 2015. Initial release.
%
% Dependence:
% colorGradient.m: http://www.mathworks.com/matlabcentral/fileexchange/31524-colorgradient--generate-custom-linear-colormaps/content/colorGradient.m
%% color coding matrix
[yax,xax]=size(mat);

figure('position',[20         20         40*xax        40*yax])

if nargin<2
    ncolor = 10;
end

colormap(colorGradient([1 1 1],[0 1 0], ncolor))

% 1. rescale the mat
normalize = @(x) (x- min(x(:)))/(max(x(:)) - min(x(:)));
plot_data  = normalize(mat);

% 2. draw heatmap
xaxs = (1:xax);%-0.5;
yaxs = (1:yax);%-0.5;

imagesc(xaxs,yaxs,plot_data)
% grid on;
set(gca,'xtick',0:xax,'ytick',0:yax,'xticklabel','','yticklabel','')
%
hold on
arrayfun(@(x) plot([x x],[0 yaxs(end)+0.5],'k'),xaxs(1:end-1)+0.5)
arrayfun(@(y) plot([0 xaxs(end)+0.5],[y y],'k'),yaxs(1:end-1)+0.5)
%%

% round to ndigits
if nargin<3
    ndigits =2;
end

text_data = round(mat*10^ndigits)/(10^ndigits);

% add text
for x = 1:length(xaxs)
    for y = 1:length(yaxs)
        text(xaxs(x),yaxs(y),num2str(text_data(y,x)),'HorizontalAlignment','center') % show before scaling
    end
end

end

%%
上述方法依赖于colorGradient方法,其具体实现如下:
function [grad,im]=colorGradient(c1,c2,depth)
% COLORGRADIENT allows you to generate a gradient between 2 given colors,
% that can be used as colormap in your figures.
%
% USAGE:
%
% [grad,im]=getGradient(c1,c2,depth)
%
% INPUT:
% - c1: color vector given as Intensity or RGB color. Initial value.
% - c2: same as c1. This is the final value of the gradient.
% - depth: number of colors or elements of the gradient.
%
% OUTPUT:
% - grad: a matrix of depth*3 elements containing colormap (or gradient).
% - im: a depth*20*3 RGB image that can be used to display the result.
%
% EXAMPLES:
% grad=colorGradient([1 0 0],[0.5 0.8 1],128);
% surf(peaks)
% colormap(grad);
%
% --------------------
% [grad,im]=colorGradient([1 0 0],[0.5 0.8 1],128);
% image(im); %display an image with the color gradient.

% Copyright 2011. Jose Maria Garcia-Valdecasas Bernal
% v:1.0 22 May 2011. Initial release.

%Check input arguments.
%input arguments must be 2 or 3.
error(nargchk(2, 3, nargin));

%If c1 or c2 is not a valid RGB vector return an error.
if numel(c1)~=3
    error('color c1 is not a valir RGB vector');
end
if numel(c2)~=3
    error('color c2 is not a valir RGB vector');
end

if max(c1)>1&&max(c1)<=255
    %warn if RGB values are given instead of Intensity values. Convert and
    %keep procesing.
    warning('color c1 is not given as intensity values. Trying to convert');
    c1=c1./255;
elseif max(c1)>255||min(c1)<0
    error('C1 RGB values are not valid.')
end

if max(c2)>1&&max(c2)<=255
    %warn if RGB values are given instead of Intensity values. Convert and
    %keep procesing.
    warning('color c2 is not given as intensity values. Trying to convert');
    c2=c2./255;
elseif max(c2)>255||min(c2)<0
    error('C2 RGB values are not valid.')
end
%default depth is 64 colors. Just in case we did not define that argument.
if nargin < 3
    depth=64;
end

%determine increment step for each color channel.
dr=(c2(1)-c1(1))/(depth-1);
dg=(c2(2)-c1(2))/(depth-1);
db=(c2(3)-c1(3))/(depth-1);

%initialize gradient matrix.
grad=zeros(depth,3);
%initialize matrix for each color. Needed for the image. Size 20*depth.
r=zeros(20,depth);
g=zeros(20,depth);
b=zeros(20,depth);
%for each color step, increase/reduce the value of Intensity data.
for j=1:depth
    grad(j,1)=c1(1)+dr*(j-1);
    grad(j,2)=c1(2)+dg*(j-1);
    grad(j,3)=c1(3)+db*(j-1);
    r(:,j)=grad(j,1);
    g(:,j)=grad(j,2);
    b(:,j)=grad(j,3);
end

%merge R G B matrix and obtain our image.
im=cat(3,r,g,b);
2. 可视化混淆矩阵
机器学习的分类问题中,经常会用到混淆矩阵,这里给出其可视化效果如下:

function [confusion_matrix overall_pcc group_stats groups_list] = confusionMatrix3d(predicted_groups,actual_groups)
% confusionMatrix3d
%
% version 1.2 (April 2012)
% (c) Brian Weidenbaum
% website: http://www.BrianWeidenbaum.com/.
% Special thanks to the Department of Marketing at Universiteit Gent:
% http://www.feb.ugent.be/MarEco/ENG/.
%
%
% DESCRIPTION:
% Confusion matrix-based model performance summary tool.
% Works with character and numeric data, for any number of groups.
%
% Displays your confusion matrix as a 3D bar chart of your observations,
% broken down by their actual and predicted groups.
%
% Takes into account the chance that your predicted and actual groups may
% contain some mutually exclusive groups/classes.
% Assumes that union(predicted and actual_groups) contains all
% possibilities for Groups.
%
% Returns the overall PCC and the following stats per group:
% True Positives, False Positives, True Negatives, False Negatives,
% Sensitivity, Specificity, PCC.
%
%
% OUTPUT:
% 1) a 3D Bar Chart of the number of observations per group predicted as
% each group (helps you visualize the performance of your model in
% predicting each of several groups).  X and Y tick labels are the
% names (char or numeric) of your predicted and actual groups in ascending
% alphanumeric order (the same order in the groups_list variable).
%
% 2) confusion_matrix (matrix of doubles): the counts underlying the 3D Bar
% Chart confusion matrix, where columns are different predicted groups, in
% ascending alphanumeric order, and rows are different actual groups, in
% ascending alphanumeric order (the same order in the groups_list variable)
%
% 3) overall_pcc (double): the overall Percent Correctly Classified in your data
%
% 4) group_stats (cell array of structs), where each struct contains:
%       group -- the name of the group for the current stat struct
%       TP, FP, FN,TN  -- True&False Positives&Negatives for the group
%       sensitivity -- TP/(TP+FN) for the group
%       specificity -- TN/(TN+FP) for the group
%       PCC -- (TP+TN)/(TP+TN+FP+FN) for the group
% the cell array's structs are arranged in alphanumeric order of
% group names.
%
% 5) groups_list (cell array of chars or vector): the names of groups in
% alphanumeric order, the same order as they appear on the Confusion Matrix
% 3D Bar Chart and in the group_stats cell array.
%
% INPUTS
% parameter_name (datatype)-- description
% 1) predicted_groups (vector of numeric/logicals, or cell array of chars)--
% The group for each observation, as predicted by your model.  If you are
% using a logistic regression model, you need to translate the predicted
% logit scores/ probabilities into groups, based on your own cutoff
% value(s), and then feed those groups into this function.
%
% 2) actual_groups (vector of numeric/logicals, or cell array of chars)--
% The group for each observation, based on your actual data.
%
% Note: if one of these two inputs is a cell array of chars, both need to
% be cell arrays of chars.
%
%
% Changes between versions 1.1 and 1.2
% Revised formulas for sensitivity and specificity to reflect http://en.wikipedia.org/wiki/Sensitivity_and_specificity
%

    % PHASE 1: INPUT VALIDATION

    %force both vectors to be column vectors
    predicted_groups = reshape(predicted_groups,length(predicted_groups),1);
    actual_groups=reshape(actual_groups,length(actual_groups),1);

    %check equal length for each vector
    if ~(length(predicted_groups)==length(actual_groups))
       error('Both input vectors must be the same length.');
    end

    %check for equal types within the vectors;
    %eg both must be cell array of chars or vectors/cell arrays of numbers
    %if pred=cell, and everything in it is char,
    if iscell(predicted_groups) && all(cellfun('isclass',predicted_groups,'char'))
        %actual must be a cell array of all chars...
        %if act<>(cell with all elements=char)
        if ~(iscell(actual_groups) && all(cellfun('isclass',actual_groups,'char')))
            error('If one of your input vectors is a cell array of characters, so must be the other one.');
        end
    %elsif pred=cell, and not everything in it is a char, it should be all numbers
    elseif iscell(predicted_groups) && ~all(cellfun('isclass',predicted_groups,'char'))
        try
           predicted_groups=cell2mat(predicted_groups);
        catch e
           disp(e.message);
        end
    end

    %do same for actual_groups vector
    if iscell(actual_groups) &&  all(cellfun('isclass',actual_groups,'char'))
        if ~(iscell(predicted_groups) && all(cellfun('isclass',predicted_groups,'char')))
            error('If one of your input vectors is a cell array of characters, so must be the other one.');
        end
    elseif iscell(actual_groups) && ~all(cellfun('isclass',actual_groups,'char'))
        try
           actual_groups=cell2mat(actual_groups);
        catch e
           disp(e.message);
        end
    end

    %END INPUT VALIDATION


    %PHASE 2: CREATE AND PLOT 3D CONFUSION MATRIX
    n_obs = size(predicted_groups,1);
    groups_list = union(actual_groups,predicted_groups);
    ngroups = length(groups_list);

    %now translate all predicted and actual groups to one of 1:N, where n=length groups list
    %eg if groupslist = 'a', 'b', 'c', groupnbrs = 1:3,
%     and the following data: 'a', 'a', 'c','b'=> 1 1 3 2
    if iscell(groups_list)
       acts = cellfun(@(x)find(strcmp(x,groups_list)),actual_groups);
       preds = cellfun(@(x)find(strcmp(x,groups_list)),predicted_groups);
    else
        acts = arrayfun(@(x)find(x==groups_list),actual_groups);
        preds = arrayfun(@(x)find(x==groups_list),predicted_groups);
    end

    %fill confusion matrix with counts
    confusion_matrix=zeros(ngroups);
    for i=1:n_obs
        predicted= preds(i);
        actual=acts(i);
        confusion_matrix(actual,predicted)=confusion_matrix(actual,predicted)+1;
    end


    %now get TN, TP, FP, FN per class
    group_stats = cell(1,ngroups);
    cols = 1:ngroups; rows= 1:ngroups;
    overall_pcc= 0;
    for class=1:ngroups
        if iscell(groups_list)
           stats.group = groups_list{class};
        else
           stats.group = groups_list(class);
        end
        stats.TP = confusion_matrix(class,class);
        stats.TN = sum(sum(confusion_matrix(rows(rows~=class),cols(cols~=class))));
        stats.FP = sum(sum(confusion_matrix(rows(rows~=class),cols(cols==class))));
        stats.FN = sum(sum(confusion_matrix(rows(rows==class),cols(cols~=class))));
       stats.sensitivity = stats.TP / (stats.TP+stats.FN);
       stats.specificity = stats.TN / (stats.TN+stats.FP);
       stats.PCC = (stats.TP+stats.TN) / (stats.TN+stats.FN+stats.TP+stats.FP);
       overall_pcc = overall_pcc+stats.PCC;
        group_stats{class}=stats;
    end
    %overall pcc is the average pcc of all groups
    overall_pcc =overall_pcc/ngroups;

    %bar chart
	bar3(confusion_matrix);
    % x vals are the columns of confusion, ys are the rows of confusion
    set(gca,'YTickLabel',groups_list);
    set(gca,'XTickLabel',groups_list);
    ylabel('Actual Group');
    xlabel('Predicted Group');
    zlabel('Number of Observations');
    title({'Observations by Predicted and Actual Groups'; ['Overall PCC: ' num2str(overall_pcc*100) '%']},'fontsize',14);

%     PHASE 3: PROFIT
end%fx
使用方法如下:
predict = [1,2,5,8,5,2,5,7,6,5,8,4,4,5,5,6,2];
actual = [1,2,5,3,5,2,5,2,6,5,8,4,1,5,5,6,2];
confusionMatrix3d(predict,actual);
笔者对数据可视化比较感兴趣,如果想了解更多关于Matlab可视化的方法,可以关注一下。同时,也可以访问MathWorks官网查看最新的工具箱更新情况,寻找适合自己的可视化工具。
