再阿里云添加AK账号授权

注意:当AK创建只是用来编程访问的话,要保存一下信息,不然找不到

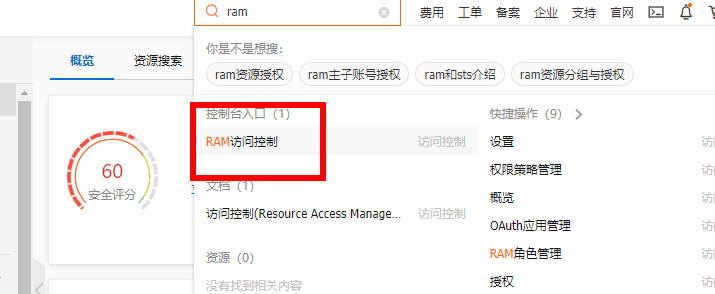
开始授权监控的权限。

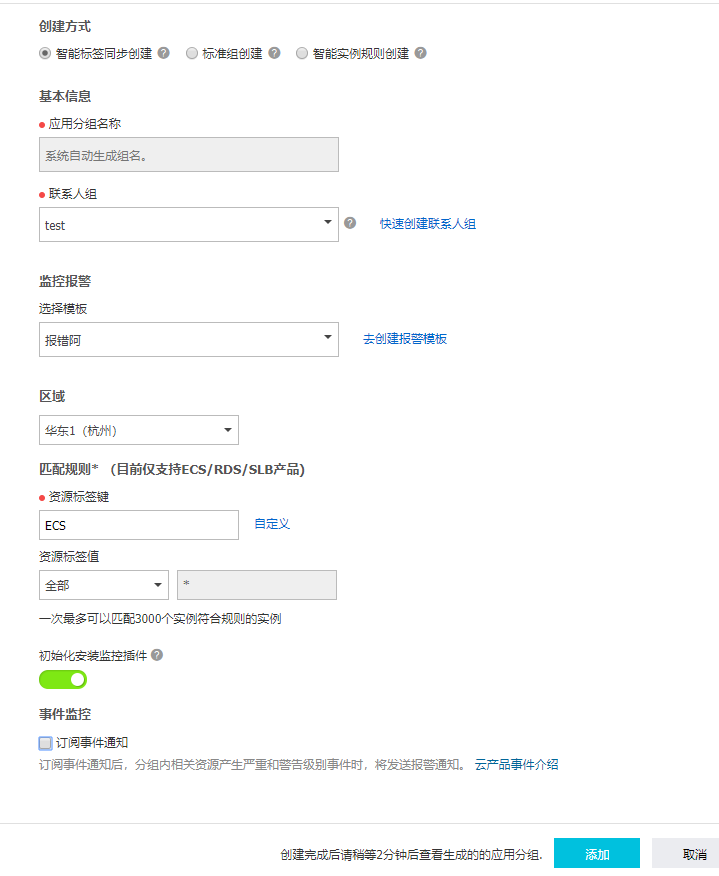
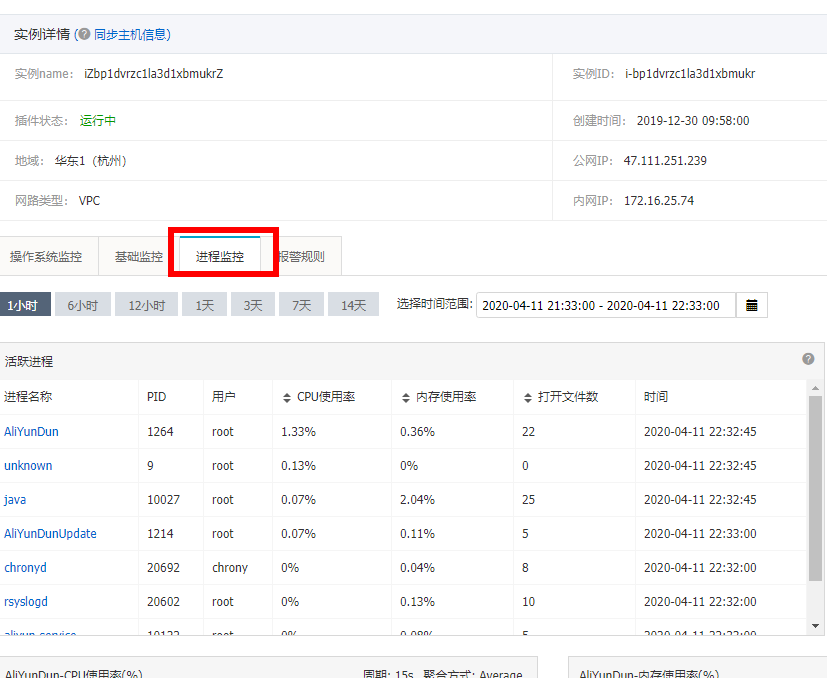
云监控检查主机是否安装插件添加应用分组
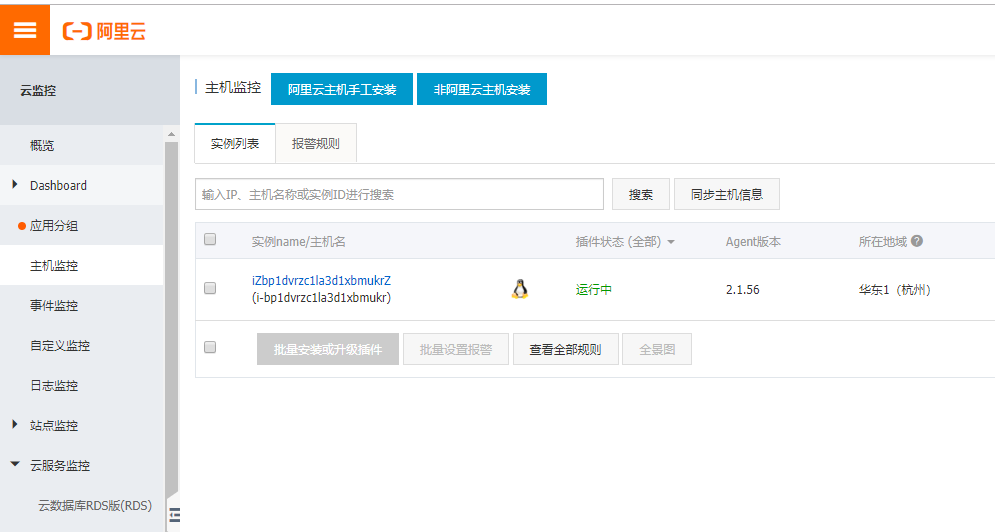
当监控插件初始花以后,能看到进程监控,说明就可以了。
在别的一台阿里云安装grafana
[root@iZbp143t3oxhfc3ar7jey0Z ~]# yum localinstall  grafana-5.0.3-1.x86_64.rpm
Loaded plugins: fastestmirror
Examining grafana-5.0.3-1.x86_64.rpm: grafana-5.0.3-1.x86_64
Marking grafana-5.0.3-1.x86_64.rpm to be installed
Resolving Dependencies
--> Running transaction check
---> Package grafana.x86_64 0:5.0.3-1 will be installed
--> Processing Dependency: fontconfig for package: grafana-5.0.3-1.x86_64
Loading mirror speeds from cached hostfile
 * webtatic: us-east.repo.webtatic.com
--> Processing Dependency: urw-fonts for package: grafana-5.0.3-1.x86_64
--> Running transaction check
---> Package fontconfig.x86_64 0:2.13.0-4.3.el7 will be installed
[root@iZbp143t3oxhfc3ar7jey0Z ~]# git clone https://github.com/aliyun/aliyun-cms-grafana.git
Cloning into 'aliyun-cms-grafana'...
remote: Enumerating objects: 48, done.
remote: Counting objects: 100% (48/48), done.
remote: Compressing objects: 100% (38/38), done.
remote: Total 132 (delta 19), reused 21 (delta 8), pack-reused 84
Receiving objects: 100% (132/132), 299.29 KiB | 11.00 KiB/s, done.
Resolving deltas: 100% (49/49), done.
把插件放进去,并重启
[root@iZbp143t3oxhfc3ar7jey0Z ~]# service grafana-server start
Starting grafana-server (via systemctl):                   [  OK  ]
[root@iZbp143t3oxhfc3ar7jey0Z ~]# pwd
/root
[root@iZbp143t3oxhfc3ar7jey0Z ~]# mv a
aaa.text            aliyun-cms-grafana/
[root@iZbp143t3oxhfc3ar7jey0Z ~]# mv aliyun-cms-grafana/ /var/lib/grafana/plugins/
[root@iZbp143t3oxhfc3ar7jey0Z ~]# cd /var/lib/grafana/plugins
[root@iZbp143t3oxhfc3ar7jey0Z plugins]# ll
total 4
drwxr-xr-x 6 root root 4096 Apr 11 22:44 aliyun-cms-grafana
[root@iZbp143t3oxhfc3ar7jey0Z plugins]# service grafana-server restart
Restarting grafana-server (via systemctl):                 [  OK  ]
[root@iZbp143t3oxhfc3ar7jey0Z plugins]# lsof -i:3000
COMMAND    PID    USER   FD   TYPE   DEVICE SIZE/OFF NODE NAME
grafana-s 2080 grafana    6u  IPv6 10914108      0t0  TCP *:hbci (LISTEN)
grafana-s 2080 grafana    9u  IPv6 10913566      0t0  TCP iZbp143t3oxhfc3ar7jey0Z:hbci->36.5.244.169:16883 (ESTABLISHED)
grafana-s 2080 grafana   10u  IPv6 10914166      0t0  TCP iZbp143t3oxhfc3ar7jey0Z:hbci->36.5.244.169:16884 (ESTABLISHED)
grafana-s 2080 grafana   12u  IPv6 10914168      0t0  TCP iZbp143t3oxhfc3ar7jey0Z:hbci->36.5.244.169:16890 (ESTABLISHED)
grafana-s 2080 grafana   14u  IPv6 10913568      0t0  TCP iZbp143t3oxhfc3ar7jey0Z:hbci->36.5.244.169:16889 (ESTABLISHED)
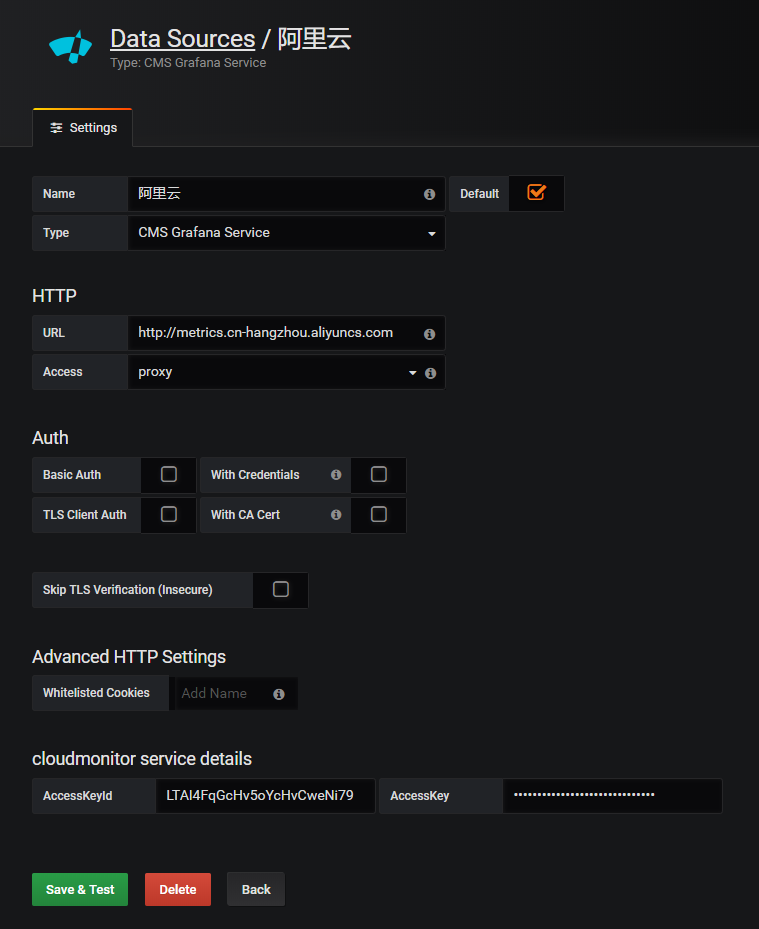
添加数据源
添加和配置Dashboard。
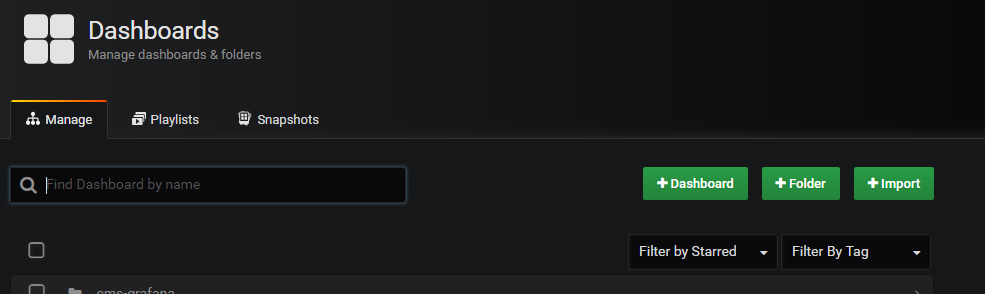
您可以选择创建一个
Folder后,再创建Dashboard,您也可以导入其他Dashboard。
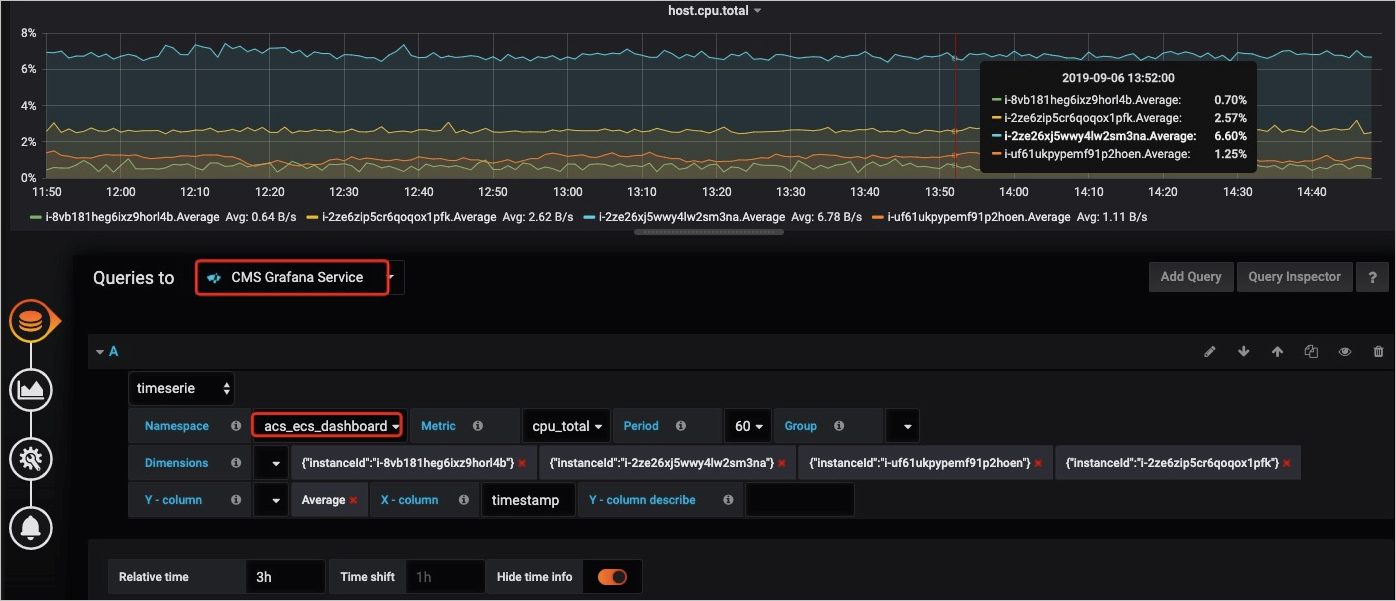
- 在New Panel的Add下选择Graph图表。
- 单击Pannel Title,在弹出的窗口中单击Edit。
- 在Metrics配置中,选择datasource为cms-grafana,配置参数Project、Metric、period、Y轴和X轴。
Project、Metric、Period等参数详情,请参见QueryMetricList。
参数 说明 Group 云账户所在云监控的应用分组。 Dimensions Project与Metric所在监控项最新监控数据的实例集合,若选Group,则为该Group下的实例。 Y-column 可支持多选。 X-column timestamp。 Y-column describe 对Y-column的区分描述。 说明- 如果您需要了解更多Graph信息,请单击Graph。
- 所有参数均可按照QueryMetricList的要求手动输入。
- 所有已选择或已输入参数均可输入null取消。
- 如果对应场景下Dimensions的提示信息不全,则需要刷新或按照样例手动输入InstanceId的值即可。
 自定义监控的部分参数信息需要手动输入,参数说明如下表所示。
参数 说明 Project acs_customMetric_+云账号ID。 Metric 上报监控数据的metricName。 Period 上报监控数据时的Period。 Group 上报监控数据时的Metric对应的分组ID。 Dimensions 上报监控数据时的Dimension,暂不支持下拉选择,只支持输入单个Dimension,若输入多个,默认选第一个。 说明 如果云监控控制台的dimensions格式为env: public, step: 5-ReadFromAlertOnline,则请用&替换示例中的,后拼接输入。Y-column 上报监控数据时的Average、Maximum、Minimum、Sum、SampleCount、P10、P20、P99等。 X-column timestamp。 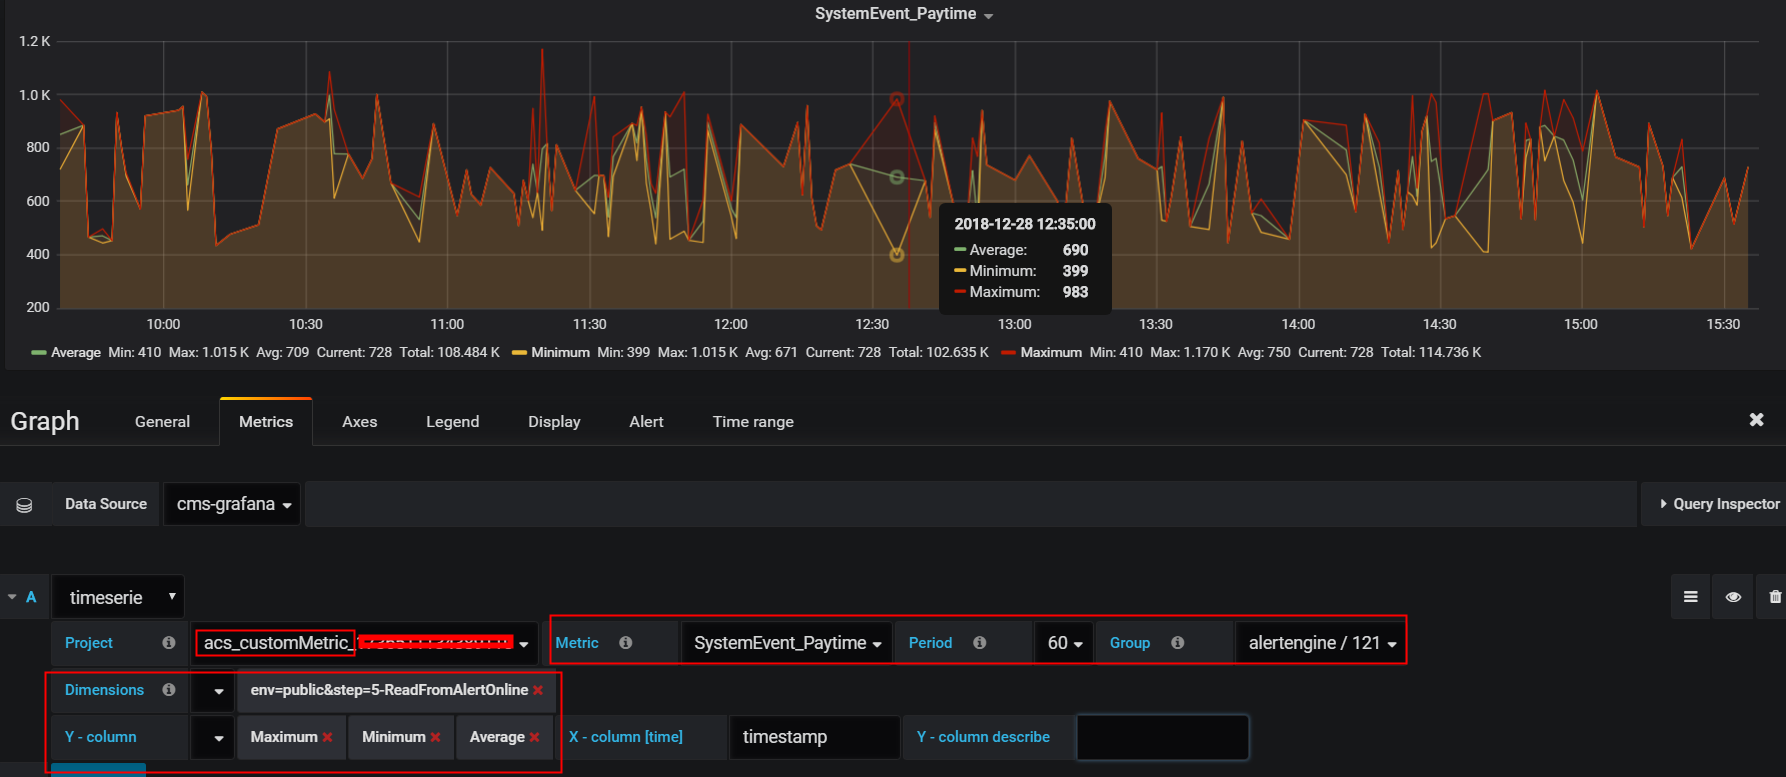
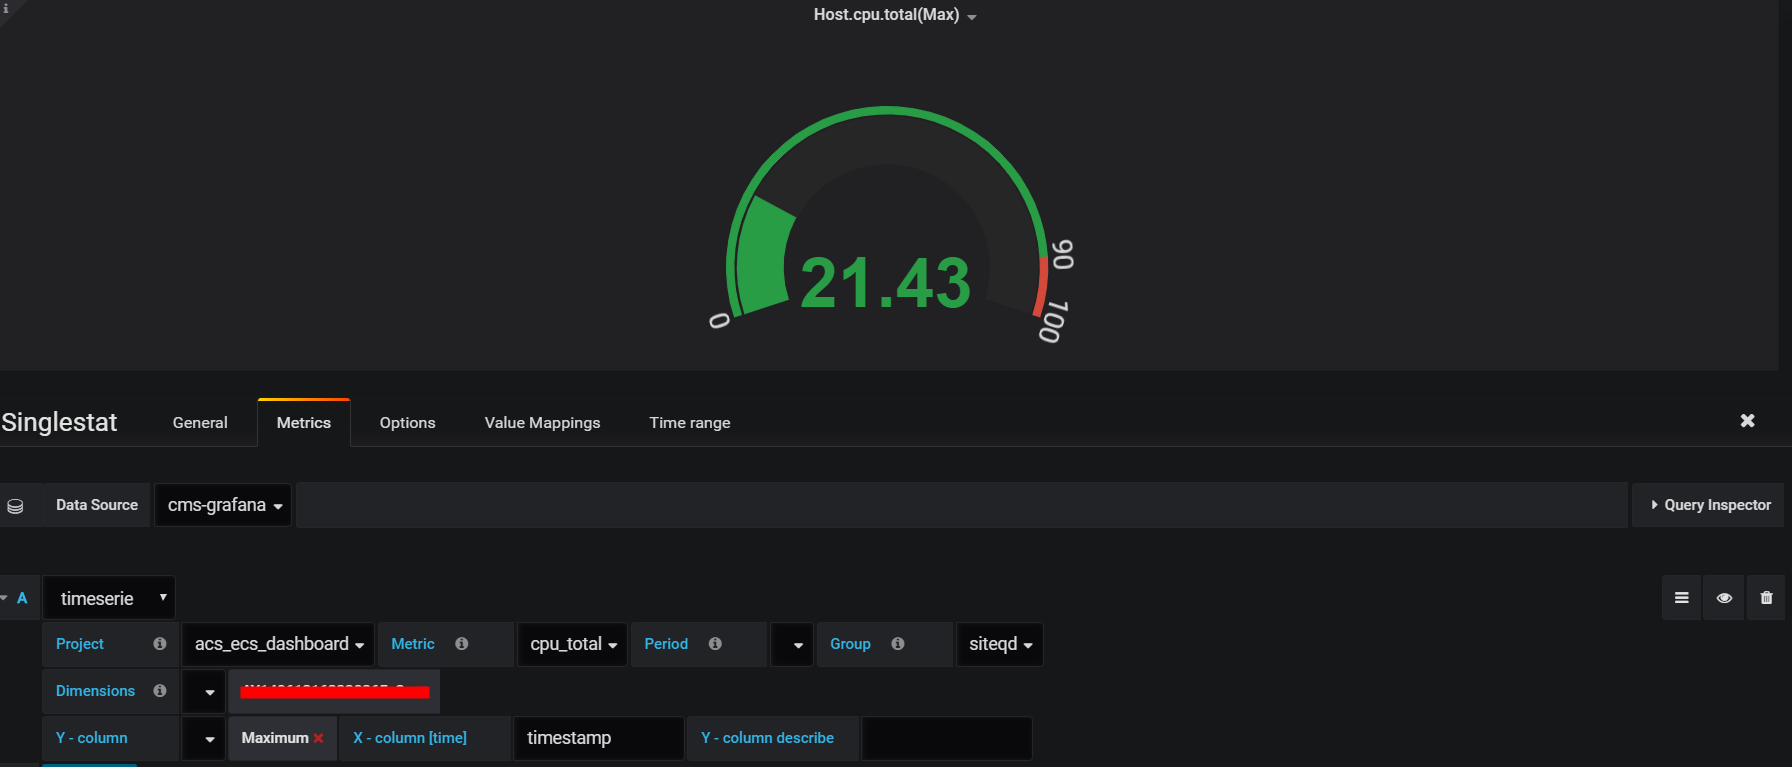
- 配置Singlestat面板。
- 在New Panel的Add下选择Singlestat。
- 单击Pannel Title,在弹出的窗口中单击Edit。
- 配置Metric相关参数。
说明 如果您需了解更多 Singlestat信息,请单击 Graph。