1.前言
散点图是比较常见的作图,用python画的效果还不错,而且调节比较灵活。
(见官方网址)
matplotlib.pyplot.scatter(x, y, s=None, c=None, marker=None, cmap=None, norm=None, vmin=None, vmax=None, alpha=None, linewidths=None, verts=None, edgecolors=None, hold=None, data=None, **kwargs)x, y : array_like, shape (n, )
Input data
s : scalar or array_like, shape (n, ), optional
size in points^2. Default is rcParams['lines.markersize'] ** 2.
c : color, sequence, or sequence of color, optional, default: ‘b’
c can be a single color format string, or a sequence of color specifications of length N, or a sequence of N numbers to be mapped to colors using the cmap and norm specified via kwargs (see below). Note that c should not be a single numeric RGB or RGBA sequence because that is indistinguishable from an array of values to be colormapped. c can be a 2-D array in which the rows are RGB or RGBA, however, including the case of a single row to specify the same color for all points.
marker : MarkerStyle, optional, default: ‘o’
See markers for more information on the different styles of markers scatter supports. marker can be either an instance of the class or the text shorthand for a particular marker.
cmap : Colormap, optional, default: None
A Colormap instance or registered name. cmap is only used if c is an array of floats. If None, defaults to rc image.cmap.
norm : Normalize, optional, default: None
A Normalize instance is used to scale luminance data to 0, 1. norm is only used if c is an array of floats. If None, use the default normalize().
vmin, vmax : scalar, optional, default: None
vmin and vmax are used in conjunction with norm to normalize luminance data. If either are None, the min and max of the color array is used. Note if you pass a norm instance, your settings for vmin and vmax will be ignored.
alpha : scalar, optional, default: None
The alpha blending value, between 0 (transparent) and 1 (opaque)
linewidths : scalar or array_like, optional, default: None
If None, defaults to (lines.linewidth,).
verts : sequence of (x, y), optional
If marker is None, these vertices will be used to construct the marker. The center of the marker is located at (0,0) in normalized units. The overall marker is rescaled by s.
edgecolors : color or sequence of color, optional, default: None
If None, defaults to ‘face’
If ‘face’, the edge color will always be the same as the face color.
If it is ‘none’, the patch boundary will not be drawn.
For non-filled markers, the edgecolors kwarg is ignored and forced to ‘face’ internally.2.二维scatter
代码:
# coding=gbk
import numpy as np
import matplotlib.pyplot as plt
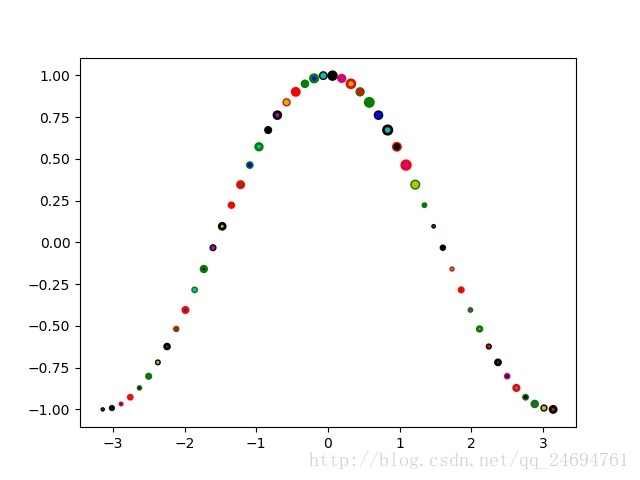
x = np.linspace(-np.pi,np.pi,50,endpoint=True) # 最末尾的点也画上
y = np.cos(x)
#--------------------------scatter-------------------------------#
# help(plt.scatter)
plt.figure()
S = [i for i in range(5,40)] # SizeData,自动循环
ColorBase = ('r','g','b','c','k','m','y') # 颜色,自动循环
Marker = 'o'
MarkerBase = (',','o','v','^','<','>','1','2','3','4','8',
's','p','*','h','+','x','D','d','|','_'
'TICKLEFT','TICKRIGHT','TICKUP','TICKDOWN',
'CARETLEFT','CARETRIGHT','CARETUP','CARETDOWN') # 向量形式
Linewidths = [1,2] # 向量形式,自动循环
EdgeColor = ('k','k','r','r','g','g')
plt.scatter(x,y,s=S,c=ColorBase,marker=Marker,linewidths=Linewidths,edgecolors=EdgeColor)
plt.savefig('2-D.jpg',fmt='jpg')2-D.jpg:
3.三维scatter
代码:
#--------------------------scatter 3-------------------------------#
from mpl_toolkits.mplot3d import Axes3D # 三维作图
# Axes3D.scatter(xs, ys, zs=0, zdir='z', s=20, c=None, depthshade=True, *args, **kwargs)
ax = Axes3D(plt.figure())
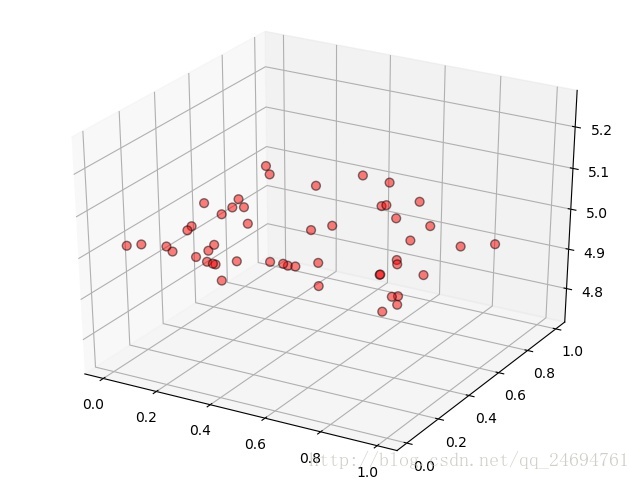
NumP = 50
x = np.random.rand(NumP)
y = np.random.rand(NumP)
z = np.random.rand(NumP)
#-----画一个平行于xy的平面-----#
ax.scatter(x,y,5,s=40,c='r',edgecolor='k',alpha=0.5)
plt.savefig('3-D-1.jpg',fmt='jpg')
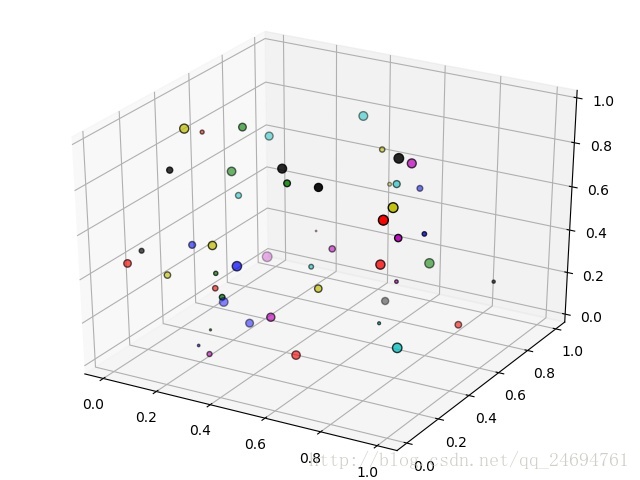
#-------改变大小和颜色--------#
ax = Axes3D(plt.figure()) # 重新创建一个
S = [i for i in range(1,NumP+1)] # It is a scalar or an array of the same length as x and y.
def GetColor(N):
NumColor = len(ColorBase)
Color = [ColorBase[0]]
Iter = 1
for i in range(N-1):
if Iter>=NumColor:
Iter = 0
Color.append(ColorBase[Iter])
Iter = Iter+1
return(Color)
Color = GetColor(NumP)
print(len(Color),Color) # c can be a single color format string;
# or a sequence of color specifications of length N;
# or a sequence of N numbers to be mapped to colors using the cmap and norm specified via kwargs (see below).
# Note that c should not be a single numeric RGB or RGBA sequence because that is indistinguishable from an array of values to be colormapped.
# c can be a 2-D array in which the rows are RGB or RGBA, however, including the case of a single row to specify the same color for all points.
ax.scatter(x,y,z,s=S,c=Color,marker=Marker,edgecolors='k')
plt.savefig('3-D-2.jpg',fmt='jpg')
#-------------------------图像显示---------------------------------#
plt.show() # 显示3-D-1.jpg:
3-D-2.jpg:
输出:
50 ['r', 'g', 'b', 'c', 'k', 'm', 'y', 'r', 'g', 'b', 'c', 'k', 'm', 'y', 'r', 'g', 'b', 'c', 'k', 'm', 'y', 'r', 'g', 'b', 'c', 'k', 'm', 'y', 'r', 'g', 'b', 'c', 'k', 'm', 'y', 'r', 'g', 'b', 'c', 'k', 'm', 'y', 'r', 'g', 'b', 'c', 'k', 'm', 'y', 'r']
4.小结
- (1)二维scatter常见的调整:marker的大小、类型、颜色、线条粗细;
- (2)三维用到Axes3D类,与二维相似,但有不同,比如输入大小、颜色向量的维数必须和点数相同,可以自己编程体会
版权声明:本文为博主原创文章,未经博主允许不得转载。
