http://echarts.baidu.com/examples/
option = {
toolbox: {
feature: {
saveAsImage: {}
}
},
xAxis: {
type: 'category',
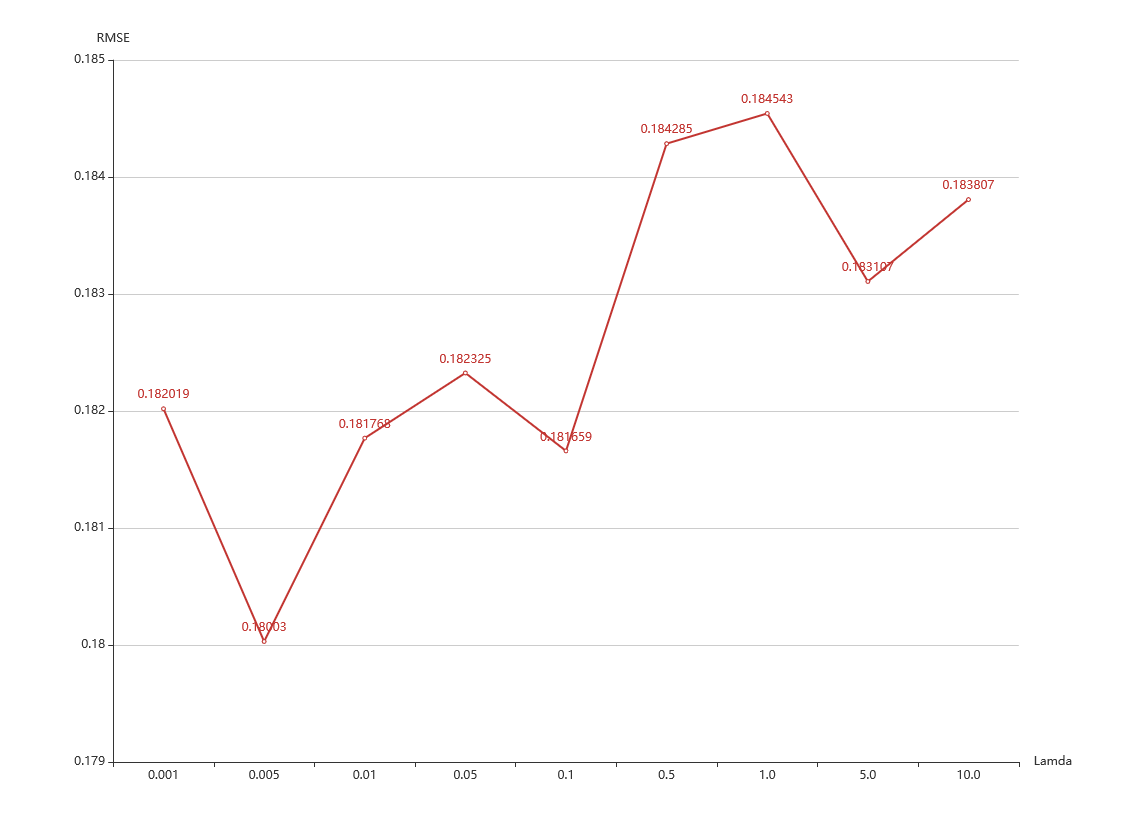
data: ['0.001', '0.005', '0.01', '0.05', '0.1', '0.5', '1.0', '5.0', '10.0'],
name: 'Lamda'
},
yAxis: {
type: 'value',
min: 0.179,
max: 0.185,
name:'RMSE'
},
series: [{
data: [0.182019, 0.180030, 0.181768, 0.182325, 0.181659, 0.184285, 0.184543,0.183107,0.183807],
type: 'line',
itemStyle : { normal: {label : {show: true}}},
}]
};
效果图: