1 <html>
2 <head>
3 <base href="<%=basePath%>">
4 <title>堆叠柱状图</title>
5 <script type="text/javascript" src="echarts.min.js"></script>
6 </head>
7 <body>
8 <div id="main" style="width: 600px;height:400px;"></div>
9 <script type="text/javascript">
10 //基于准备好的dom,初始化echarts实例
11 var myChart = echarts.init(document.getElementById('main'));
12 // 指定图表的配置项和数据
13 var option = {
14 title: {
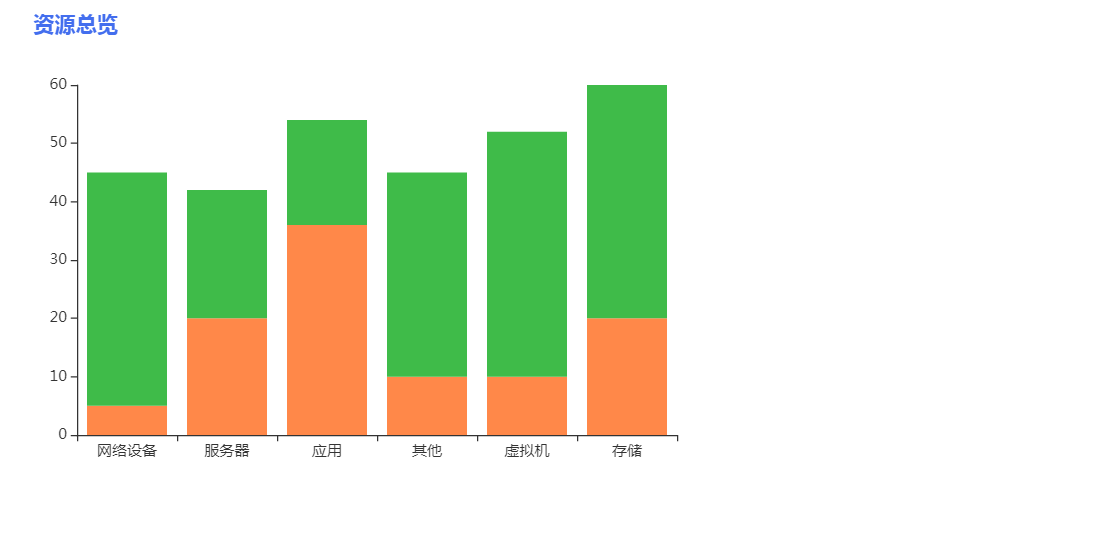
15 text: '资源总览',
16 left:'20px',
17 textStyle: {
18 color: "#436EEE",
19 fontSize: 17,
20 }
21 },
22 tooltip: {
23 trigger: "axis",
24 },
25 // legend: {
26 // itemWidth:15,
27 // itemHeight:15,
28 // data:['可用','不可用'],
29 // },
30 xAxis: {
31 data: ["网络设备","服务器","应用","其他","虚拟机","存储"],
32 splitLine:{
33 show:false,
34 },
35 },
36 yAxis: {
37 splitLine:{
38 show:false,
39 },
40 },
41 series: [{
42 name: '可用',
43 type: 'bar',
44 stack:'1',//根据此参数来堆叠数据
45 data: [5, 20, 36, 10, 10, 20],
46 itemStyle:{
47 normal:{color:"#FF8849"},
48 }
49 },{
50 name: '不可用',
51 type: 'bar',
52 stack:'1',//根据此参数来堆叠数据
53 data: [40, 22, 18, 35, 42, 40],
54 itemStyle:{
55 normal:{color:"#3FBB49"},
56 }
57 }]
58 };
59 // 使用刚指定的配置项和数据显示图表。
60 myChart.setOption(option);
61 </script>
62 </body>
63 </html>
效果图:
代码下载https://files.cnblogs.com/files/jsliao/echarts%E5%A0%86%E7%A7%AF%E5%9B%BEdemo.rar