文章目录
很实用 - Pandas(资料的前处理)
一,Series
1,生成Series物件
Series是一维度资料结构的物件,跟 list 很象
在Series中会有每个元素的 label index
import numpy as np
import pandas as pd
使用pandas.Series() 造出series物件
输入可以使 list,dict,np.array
pds = pd.Series(np.random.rand(10))
pds
>>>0    0.117772
1    0.796198
2    0.445113
3    0.138658
4    0.064557
5    0.812834
6    0.156363
7    0.701963
8    0.508142
9    0.712087
dtype: float64
2,输出内容与index
mylist = [123,'hello',5.5,'no']
pds = pd.Series(mylist)
输出内容:series_name.values
tmp = pds.values
print(type(tmp))
print(tmp)
>>><class 'numpy.ndarray'>
   [123 'hello' 5.5 'no']
输出索引:series_name.index
ind = pds.index
print(type(ind))
print(ind)
>>><class 'pandas.core.indexes.range.RangeIndex'>
    RangeIndex(start=0, stop=4, step=1)
3,自定义index
直接设置index
pds = pd.Series(mylist,index=['A','B','C','D'])
pds
>>>A      123
   B    hello
   C      5.5
   D       no
   dtype: object
通过 dict 方式存入,其中的 key 会变成 label index
mydict = {'A':123,'B':'hello','C':5.5,'D':'no'}
pd.Series(mydict)
>>>A      123
   B    hello
   C      5.5
   D       no
   dtype: object
4,Selection of Series
根据索引,选出对应行
pds = pd.Series(mylist,index=['A','B','C','D'])
pds[['A','D']]
>>>A    123
   D     no
   dtype: object
选择第一行和第二行,并将其中的数值 x2
pds[[1,2]]
>>>1    0.877871
   2    0.087786
   dtype: float64
pds[[1,2]]*2
>>>1    1.755741
   2    0.175573
   dtype: float64
选择前五行

pds[0:5]
>>>0    0.908113
   1    0.877871
   2    0.087786
   3    0.417396
   4    0.105889
   dtype: float64
选择其中大于 0.5 的数值
pds[pds > 0.5]
>>>0    0.908113
   1    0.877871
   7    0.933072
   9    0.661328
   dtype: float64
二,DataFrame物件
DataFrame是一个表格式资料结构的物件
与 spreadsheet,资料库中的 table 与 R 的 data.frame 很类似
可以把 DataFrame 理解为一堆 Series object 共享同一个 index
1,生成DataFrame物件
rmat = np.random.randn(4,5)
df = pd.DataFrame(rmat)
df

(行为index,列为column)
(每列为一个series)
2,自定义index与column
直接设置
index:日期
column:[‘A’,‘B’,‘C’,‘D’]
dates = pd.date_range('20130101',periods=6)

df = pd.DataFrame(np.random.randn(6,4), index=dates, columns=list('ABCD'))
df

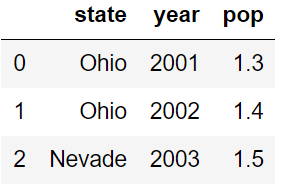
通过 dict 的形式传入数据
data = {'state':['Ohio','Ohio','Nevade'],
       'year':[2001,2002,2003],
       'pop':[1.3,1.4,1.5]}

df = pd.DataFrame(data)
df
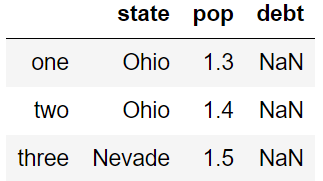
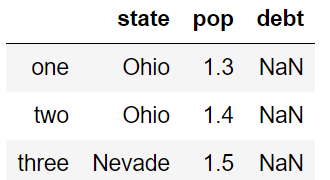
可以选择要从字典中加入的 key
当自定义的columns不在字典中,会以missing来表达(eg:debt)
data = {'state':['Ohio','Ohio','Nevade'],
       'year':[2001,2002,2003],
       'pop':[1.3,1.4,1.5]}

df = pd.DataFrame(data,columns=['state','pop','debt'],index=['one','two','three'])
df
3,输出 index,columns,value
行 - index
df.index
>>>Index(['one', 'two', 'three'], dtype='object')
列 - columns
df.columns
>>>Index(['state', 'pop', 'debt'], dtype='object')
内容 - values
df.values
>>>array([['Ohio', 1.3, nan],
       ['Ohio', 1.4, nan],
       ['Nevade', 1.5, nan]], dtype=object)
4,内容预览
下边是用sklearn中的数据
from sklearn.datasets import load_breast_cancer

BC = load_breast_cancer()
x = BC.data
y = BC.target
预览前3行(其中,默认n=5)
df = pd.DataFrame(x, columns=BC.feature_names)
df.head(n=3)

预览后3行(默认n=5)
df.tail(n=3)

5,View DataFrame:基本统计量
df.describe()

(count:总数,mean:平均值,Std:标准差,min:最小值,max:最大值)
6,Selection of Columns(选择列)
输出指定 columns
df[['mean radius','mean perimeter']]

向指定 columns 输入内容
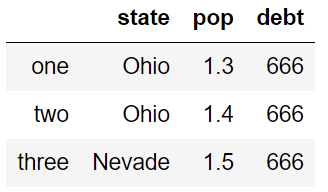
1,整列输入相同值
data = {'state':['Ohio','Ohio','Nevade'],
       'year':[2001,2002,2003],
       'pop':[1.3,1.4,1.5]}

df = pd.DataFrame(data,columns=['state','pop','debt'],index=['one','two','three'])
df['debt']=666
df
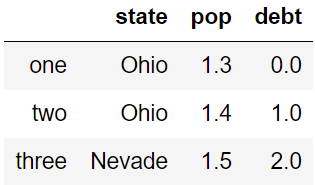
2,输入不同值
df['debt']=np.arange(3.)
df
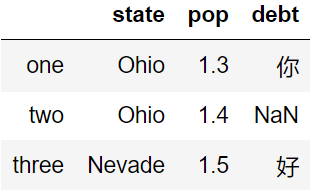
3,向指定 columns 的指定 index 输入
val = pd.Series(['你','好'],index=['one','three'])

df['debt']=val
df
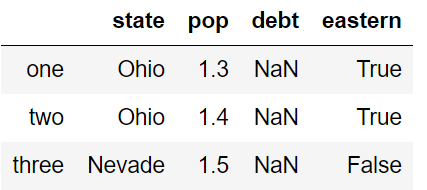
新增 columns
df['eastern']=(df['state']=='Ohio')
df
7,Selection of index(选择行)
输出指定 index
透过 slicing 来选取
输出 5~7 行
df[5:8]

Index selection with loc 与 iloc
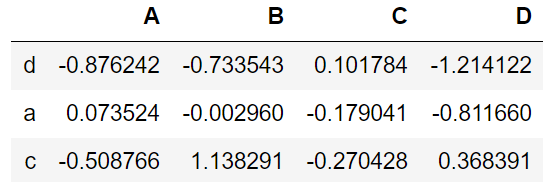
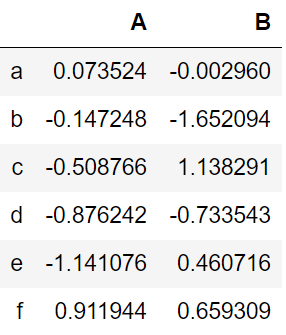
这里用 下边 这个数据进行示范
df = pd.DataFrame(np.random.randn(6,4), index=list('abcdef'), columns=list('ABCD'))
df

loc 使用名称搜索
单行
df.loc['a']
>>>A    0.073524
   B   -0.002960
   C   -0.179041
   D   -0.811660
   Name: a, dtype: float64
多个指定 index
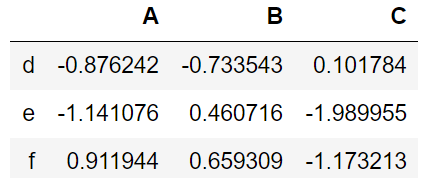
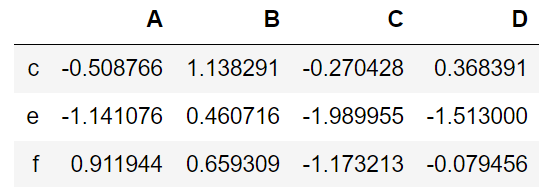
df.loc[['d','a','c']]
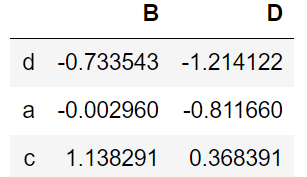
格式:df_name.loc[ [ index label ] , [ columns label ] ]
df.loc[['d','a','c'],['B','D']]
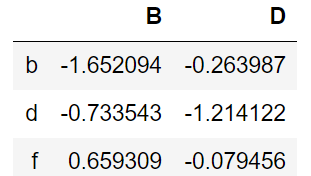
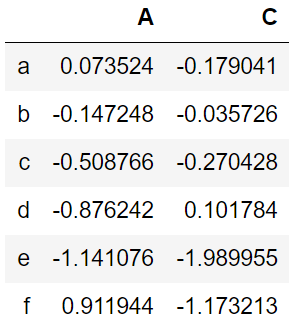
更多例子
df.loc['d':,'A':'C']
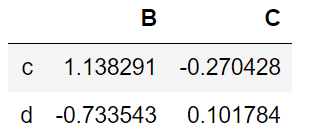
解释:df.loc[ 所有 index,‘a’行值 > -0.1 的列 ]
df.loc[:,df.loc['a'] > -0.1]
解释:‘a’行中的数值是否 大于 -0.1
df.loc['a'] > -0.1
>>>A     True
   B     True
   C    False
   D    False
   Name: a, dtype: bool
iloc 使用位置搜索
df.iloc[[1,3,5],[1,3]]
取出
index:2 ~ 4
columns:1 ~ 3
df.iloc[2:4,1:3]
所有 index 中,columns = 1位置的数值大于 0 的行
df[df.iloc[:,1]>0]
8,删除 index 或 columns
删除index
预设删掉 index(行),即 默认 axis=0
df.drop(['a','f'])

删除columns
更改参数:axis = 1
df.drop(['B','D'],axis=1)
(2020 - 03 - 21 星期六)
三,后续学习碰到的方法(不定期更新)
1,查看columns中有哪些不同的值,并计算每个值有多少个重复值
值 ----- 个数
Name:columns_name, dype: 数据格式
df['state'].value_counts()
>>>Ohio      2
   Nevade    1
   Name: state, dtype: int64
index 和 values 可以用于遍历
df['state'].value_counts().index
>>>Index(['Ohio', 'Nevade'], dtype='object')
df['state'].value_counts().values
>>>array([2, 1], dtype=int64)
2,去除数组中的重复数字,并进行排序之后输出
numpy_name.unique()
>>>array(['元素1', '元素2', ....], dtype=object)
3,转化为 list
numpy_name
>>>array(['元素1', '元素2', ....], dtype=object)

numpy_name.tolist()
>>>['元素1', '元素2', ....]
4,将函数应用到由各列或行形成的一维数组上
使用 .apply() 和 lambda
参考文献:Python中的lambda和apply用法
(2020 - 3 - 22 决策树)
5,columns的更名
df 为需要更改的Dataframe名
df.rename(columns={'原名1':'更名1', '原名2':'更名2',....},inplace=True)
(2020 - 3 - 28 朴素贝叶斯算法)
