概述
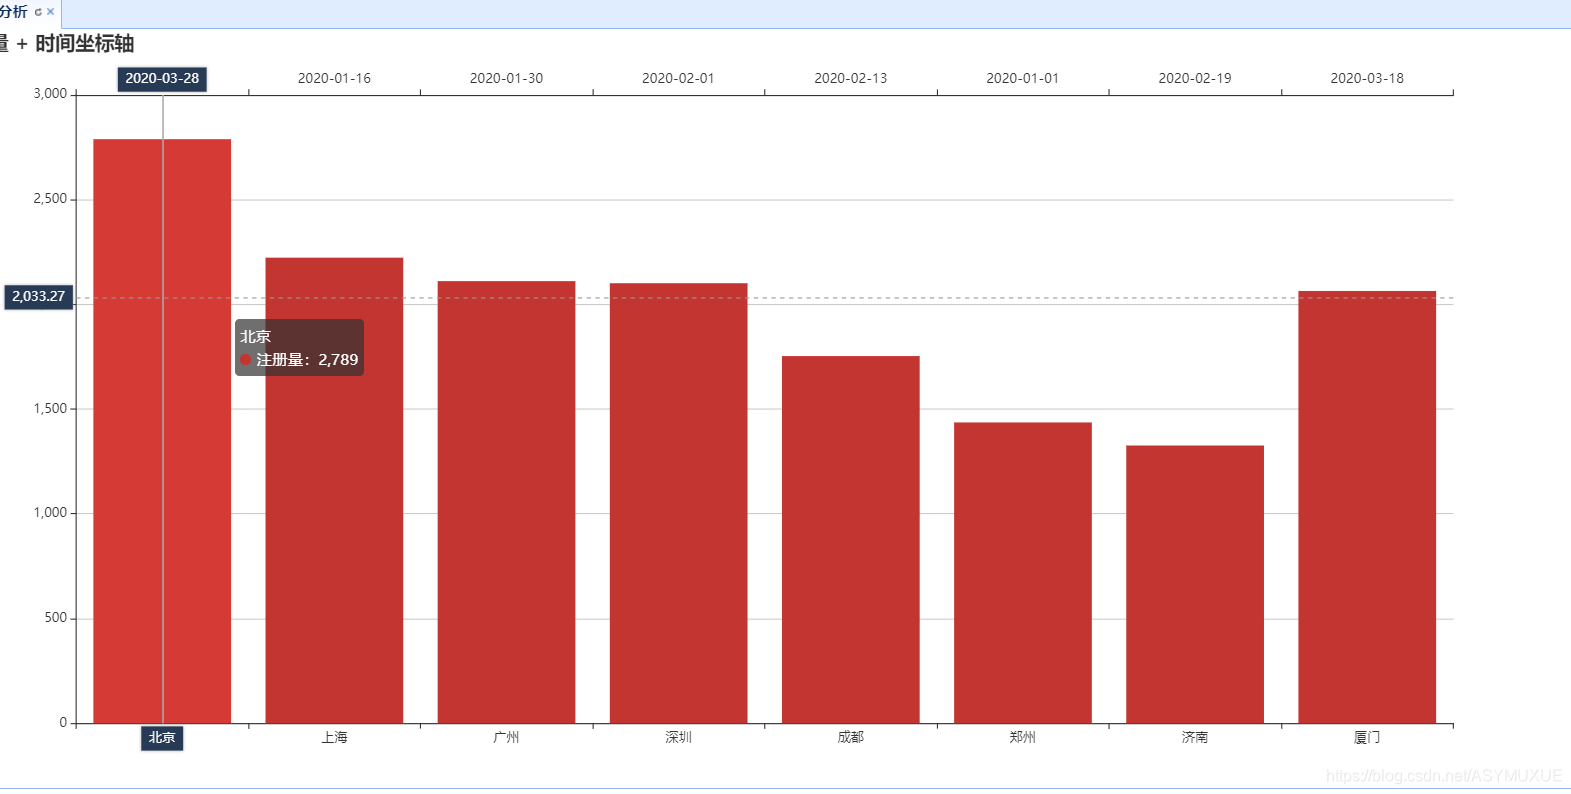
需求:使用 Echarts 动态获取数据库中的,每个城市的注册量,并展示报表。
本文将略去 控制层开发,直接上 Echarts图层的前端开发。
前提
- 已知数据库中存在一张4个字段的表,即
id、name、times(注册次数)、date(更新时间)
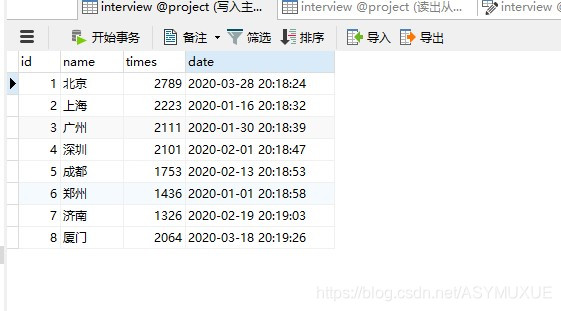 已开发好的后端。
Echarts
相关参考:
https://www.cnblogs.com/zhaoyingjie/p/5963056.html
<script>
    $(function () {
             //简单的echarts
            var myChart = echarts.init(document.getElementById('user_flow'));

                myChart.setOption({
                    title: {
                        text: '城市注册量 + 时间坐标轴'
                    },
                    tooltip: {
                        trigger: 'axis',
                        axisPointer: {
                            type: 'cross',
                            label: {
                                backgroundColor: '#283b56'
                            }
                        }
                    },

                    xAxis: [
                        {
                            data: []
                        },
                        {

                            data:[]
                        }

                    ],
                    yAxis: {
                        type: 'value'
                    },
                    series: [{
                        data: [],
                        type: 'bar'
                    }]
                });
            //展示加载动画
            myChart.showLoading()

        //发送AJAX请求,获取数据
        setInterval(function () {
            $.post(
                "/flow/get",
                function (data) {
                    //设置变量
                    var city = [];
                    var click=[];
                    var dates=[];
                    for(var i=0;i<data.length;i++){
                        //向城市数组中添加
                        city.push(data[i].name);
                        click.push(data[i].times);
                        dates.push(data[i].date);
                    }
                    //开始展示数据
                    myChart.hideLoading();
                    myChart.setOption({
                        xAxis: [
                            {
                           		data: city
                      		},
                            {
                                data: dates
                            }
                        ],
                        series: [{
                            name: "注册量",
                            data: click
                        }]
                    });
                }
            )
        },3000) //每3s请求一次服务器

        })

</script>
<div id="user_flow" style="width: 100%;height: 100%" ></div>
效果