php + ajax + mysql + echarts实现动态图表绘制
1.实现步骤:
- 用 php 从数据库里读取数据( PDO )
- 利用 ajax 请求 php 所得到的数据
- 把 ajax 请求到的数据传给 echarts
2.项目结构图:

3.html代码:
- dataIndex.html
	<!doctype html>

	<html lang="en">
	 <head>
	  <meta charset="UTF-8">
	  <meta name="Generator" content="EditPlus®">
	  <meta name="Author" content="">
	  <meta name="Keywords" content="">
	  <meta name="Description" content="">
	  <title>Document</title>
	  <style type="text/css">
		.dataSheet4{
			width:400px;
			height:600px;
		}
	  </style>
	 </head>

	 <body>
		<div class="dataSheet4" id="data"></div>
		<!--引入echarts图表框架-->
		<script src="incubator-echarts-4.2.1/dist/echarts.js"></script>
		<!--应用ajax所需要的jquery框架-->
		<script src="https://code.jquery.com/jquery-3.1.1.min.js"></script>
		<script src="js/dataSheet5.js"></script>
	 </body>
	</html>
4.js (含 ajax ) 代码:
- dataSheet5.js
	// 初始化两个数组,盛装从数据库中获取到的数据
	var dates = new Array(), moneys = new Array();
	//调用ajax来实现异步的加载数据
	function getusers() {
		$.ajax({
			type: "post",
			async: false,
			url: "dataIndex.php",
			data: {},
			dataType: "json",
			success: function(result){
			   if(result){
					for(var i = 0; i < result.length; i++){
						dates.push(result[i].times);
						moneys.push(result[i].money);
					}
				}
			},
			error: function(errmsg) {
				alert("Ajax获取服务器数据出错了!"+ errmsg);
			}
		});
		return dates, moneys;
	}
	//执行异步请求
	getusers();

	// 基于准备好的dom,初始化echarts实例
	var myChart2 = echarts.init(document.getElementById('data'));
	// 指定图表的配置项和数据
	var option = {
		title: {
			left: 'center',
			text: "ECharts"
		},
		tooltip: {
			trigger: 'axis',
			backgroundColor:'green'
		},
		toolbox: {
			show : true,
			feature : {
				dataView : {show: true, readOnly: false},
				magicType : {show: true, type: ['line', 'bar']},
				restore : {show: true},
				saveAsImage : {show: true}
			}
		},
		xAxis: {
			type: 'category',
			name:'日期',
			boundaryGap: false,
			axisTick: {
				alignWithLabel: true
			},
			data:dates
		},
		yAxis: {
			type:"value",
			name:'销售额(单位:元)',
			boundaryGap: false,
			splitLine: {
				show: true
			}
		},
		dataZoom: [
			{
				type: 'inside',
				xAxisIndex: [0],
				start: 32,
				end: 56
			},
			{
				type: 'slider',
				xAxisIndex: [0],
				start: 32,
				end: 56
			}
		],
		series: [
		{
			name:'销售额',
			type:'line',
			smooth:true,
			symbol: 'none',
			sampling: 'average',
			data:moneys
		}]
	};

	// 使用刚指定的配置项和数据显示图表。
	myChart2.showLoading(
		{"text":"正在加载数据"}
	);

	myChart2.hideLoading();
	myChart2.setOption(option);
5.php代码:
-
public_function.php
<?php function dbInit(){ global $con; $dsn = "mysql:dbname=info;localhost=127.0.0.1"; $user = "root"; $password = "644066YanMin&&!+"; try{ $con = new PDO($dsn,$user,$password); }catch(PDOExcepetion $e){ die ("Error!: " . $e->getMessage() . "<br/>"); } } /* 处理结果集中有多条数据的函数; */ function fetchAll($sql){ //申明一个全局变量 global $con; class user{ public $times; public $money; } if($result = $con->query($sql)){ //声明数组,用于接收结果集; $data = array(); //遍历结果集; while($row = $result->fetch(PDO::FETCH_ASSOC)){ $user = new User(); $user->times = $row['times']; $user->money = $row['sum']; $data[] = $user; } return $data; }else{ //执行失败; return false; } } /* 封装处理单条数据的函数; */ function fetchRow($sql){ global $con; if($result =$con->query($sql)){ $row = $result->fetch(PDO::FETCH_ASSOC); return $row; }else{ return false; } } -
dataIndex.php
 	<?php
	require "public_function.php";

	//初始化数据库连接
	dbInit();

	$sql = 'select times,sum from date';

	$datas = fetchAll($sql);

	//返回JSON类型的数据
  	echo json_encode($datas);

	//释放数据库连接
	$con = null;

	//这里一定不能加 require "html.path"
6.注意:
- 关于 echarts 的更多详细内容 ,请参考:https://echarts.baidu.com/
- html 文件 和 php 文件是分开的,是独立的,php 模块是不需要require "html.path"的,如果多余了,反而是画蛇添足。
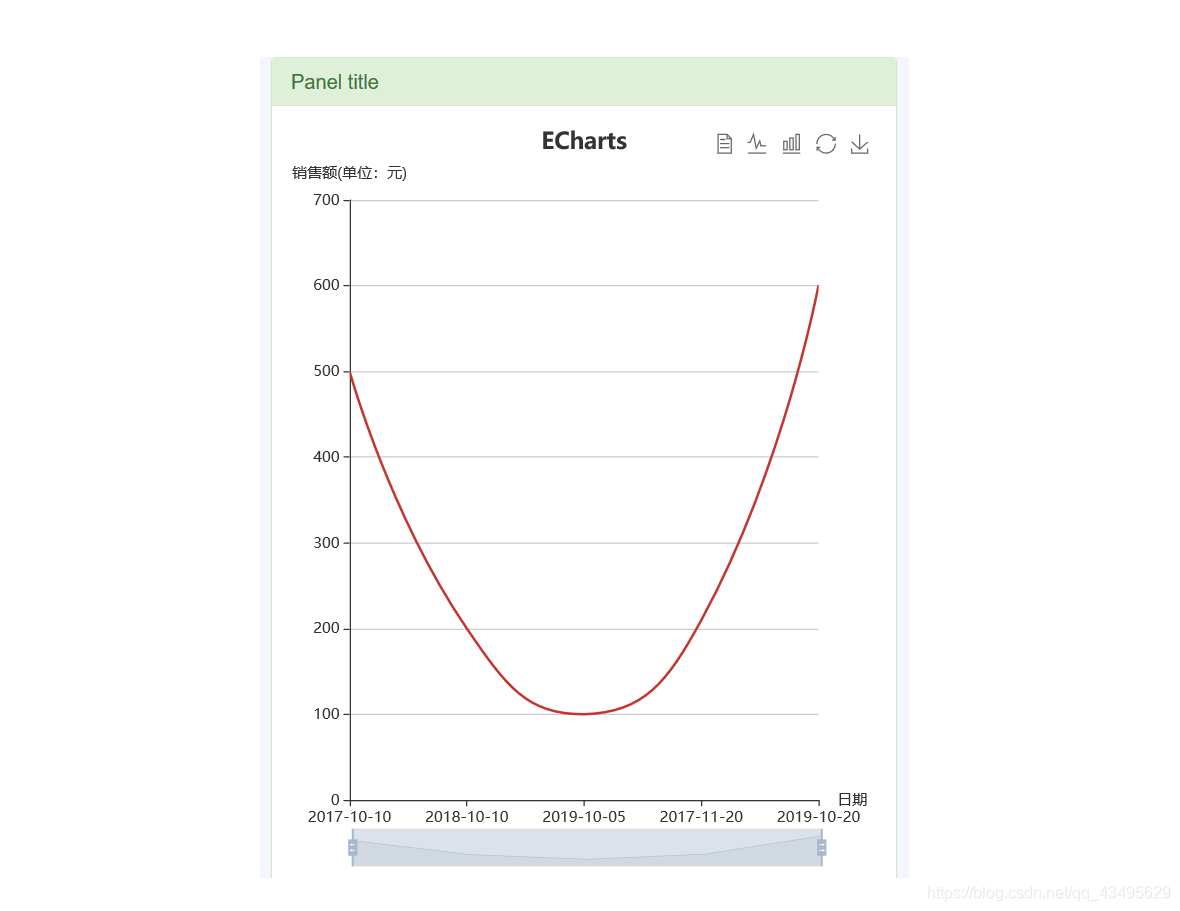
7.最终效果图:
 数据库里面的数据:

8.重点:
关于 ajax 是怎样请求到 php里面的 json 数据的,而不需要 require "html.path"模块,这里有一些个人的理解,只是个人理解,还望高手指点:
当 ajax 请求开始时,服务器会自动寻找相应的 url下的 . php 文件(其他文件也如此) ,并执行 .php 文件 (其他文件也如此),最后把从php 文件读取到的数据传递到指定位置 。
