JSXGraph是Web浏览器中的交互式几何,功能绘图,图表和数据可视化的跨浏览器JavaScript库。
用react组件化,电脑和手机,平板上都可以看到点击的点的名称
如图:
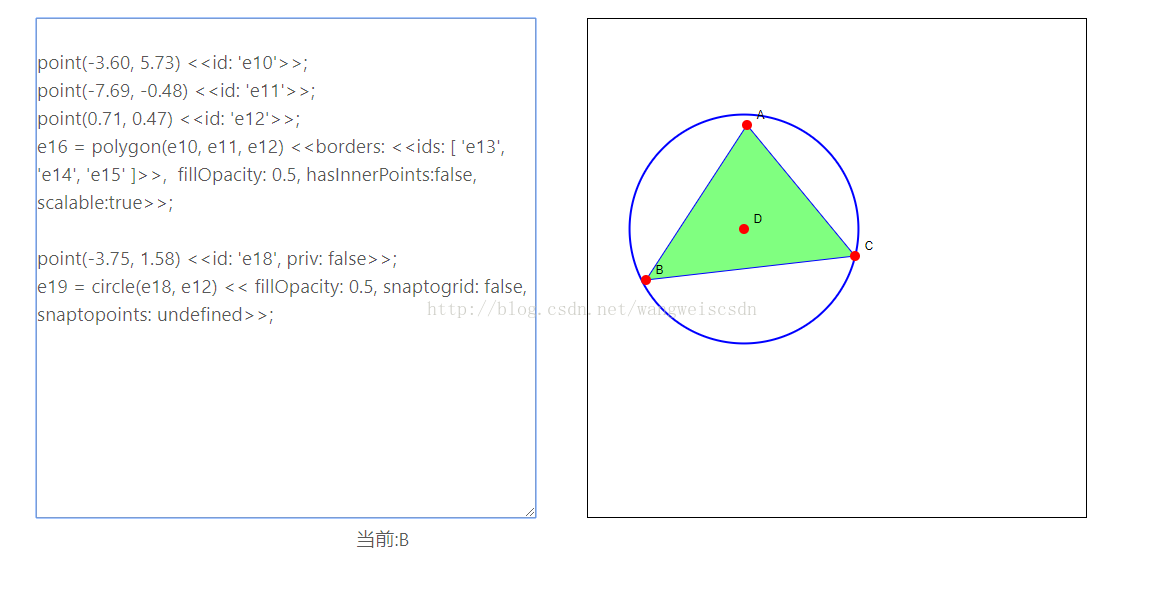
在左边框里输入代码,右边可以实现图形
react父组件如下:
import GraphComponent from './GraphComponent';
import Menubar from './Menubar';
require('styles/graphPage.scss');
class GraphPage extends React.Component{
  constructor(props) {
    super(props);

    this.textChange=(e)=>{
      e.preventDefault();
      let data=e.currentTarget.value
      const values=data.split('\n');
      let datas=values.join('');
      this.setState({values:datas});

    }

    this.handleClick=(current)=>{
        this.setState({currentName:current});

    }

    this.state = {};
  }
  render(){
    const { values='',currentName={}} = this.state;
    console.log('currentName',currentName);
    return (
    <div className='graph-container'>
      <div className='graph-problem'>
        <div className="top-left">
          <textarea name="" id="codeArea" cols="30" rows="10" onChange={this.textChange}></textarea>
          <div className="pointPosition">当前:{values ? currentName.name : ''} </div>
        </div>
        <GraphComponent values={values} handle={this.handleClick.bind(this)} change={this.textChange}/>
      </div>
    </div>
    );
  }
}
GraphPage.defaultProps = {
};

export default GraphPage;
子组件:
/**
 * Created by evewa on 2017/10/31.
 */
import JXG from 'jsxgraph';
require('styles/graphPage.scss');
class GraphComponent extends React.Component{
  constructor(props){
    super(props);
    this.shouldComponentUpdate=(nextProps, nextState)=> {
      let jc=(this.board ||{}).jc;
      if(jc){
            if(nextProps.values !== this.props.values){
              JXG.JSXGraph.freeBoard(this.board);
              this.board = JXG.JSXGraph.initBoard('box', {boundingbox: [-10, 10, 10, -10], axis:false, showCopyright: false, showNavigation: false, showReload: false});
              this.board.jc = new JXG.JessieCode();
              this.board.jc.use(this.board);
              this.board.jc.parse(nextProps.values);
              this.board.objectsList.map((item)=>{
                item.setAttribute({fixed:true});
                item.setAttribute({highlight:false});
              });
              this.board.on('down', (e) => {
                let allUnderMouse= this.board.getAllUnderMouse((e.changedTouches && e.changedTouches[0]) || e);//手机和pc的event对象结构不一样

                this.board.dehighlightAll();
                let points=allUnderMouse.filter((item)=>{ //过滤出点
                  return item instanceof JXG.Point;
                });
                if(points){
                  this.setState({points:points});
                }
                const {handle} = this.props;
                if(handle && points){
                  handle(points[0]);
                }
              });
            }else{
              jc.parse=null;
            }
        }
      return nextProps.values !== this.props.values;
    }
    this.componentDidMount = () =>{
      let board = JXG.JSXGraph.initBoard('box', {boundingbox: [-10, 10, 10, -10], axis:false,
         showCopyright: false, showNavigation: false, showReload: false});
      board.jc = new JXG.JessieCode();
      board.jc.use(board);
      const {values} = this.props;
      board.jc.parse(values);
      board.objectsList.map((item)=>{
        item.setAttribute({fixed:true});
        item.setAttribute({highlight:false});
      });
      board.on('down', (e) => {
        let allUnderMouse= board.getAllUnderMouse((e.changedTouches && e.changedTouches[0]) || e);//手机和pc的event对象结构不一样
        // console.log('board',board);

       board.dehighlightAll();
        let points=allUnderMouse.filter((item)=>{ //过滤出点
          return item instanceof JXG.Point;
        })
        if(points){
          this.setState({points:points});
        }

        const {handle} = this.props;
        if(handle && points){
            handle(points[0]);
        }
      });
      this.board = board;
      board.update();

    }

    this.componentWillUnmount = () =>{
      if (this.board) {
        JXG.JSXGraph.freeBoard(this.board);
      }
    }
    this.state={};
  }

  render(){
    return (
      <div className="top-right">
        <div id="box" className="jxgbox box"></div>
      </div>
    );
  }
}
export default GraphComponent;
graphPage.scss代码如下:
//竖屏 css
@media screen and (orientation: portrait){

  html{
    width: 100vw;
    min-width: 100vw;
    height: 100vh;
    min-height: 100vh;
  }
  .top-right{
    //flex:1;
    .box{
      //width: 100%;
      //height:45vh;
      border:1px solid #000;
      width: 100%;
      height: 0;
      padding-bottom: 100%;
    }
  }
  .graph-container{
    //font-size: 1.2rem;
    //width: 100vw;
    .graph-problem{
      //padding-top: 2rem;
      display: flex;
      flex-direction: column;
      .top-left{
        //flex:1;
        textarea {
          //overflow: auto;
          //width: 100%;
          //height:40vh;
          width: 100%;
          height: 0;
          padding-bottom: 100%;
        }

      }

    }
  }
}
//横屏 css
@media screen and (orientation: landscape){
html{
  width: 100vw;
  min-width: 100vw;
  height: 100vh;
  min-height: 100vh;
}
  .top-right{
    //flex:1;
    .box{
      //width:500px;
      //height:500px;
      border:1px solid #000;
      width: 100%;
      height: 0;
      padding-bottom: 100%;
    }
  }
  .graph-container{
    //font-size: 1.2rem;
    .graph-problem{
      //padding-top: 5rem;
      //display: flex;
      .top-left{
        //flex:1;
        textarea {
          overflow: auto;
          //width: 500px;
          //height: 500px;
          //margin-left: 10rem;
          width: 100%;
          height: 0;
          padding-bottom: 100%;
        }

      }


    }
  }
}
.top-right{
  flex:1;
}
.graph-container{
  font-size: 1.2rem;
  .graph-problem{
    //margin-top: 5rem;
    display: flex;
    .top-left{
      flex:1;
      textarea {
        //overflow: auto;
        //width: 500px;
        //height: 500px;
        //margin-left: 10rem;
      }

    }

  }
}
参考链接:http://jsxgraph.uni-bayreuth.de/docs/symbols/JXG.Board.html
可以在这个 http://bin.sketchometry.com/页面的画图代码copy过来复制到左边框里,右边就能看到一样的图形
