Relationship between urban climate and sea
Import Package
import numpy as np
import pandas as pd
from pandas import Series, DataFrame
import matplotlib.pyplot as plt
%matplotlib inline


from pylab import mpl
mpl.rcParams['font.sans-serif'] = ['FangSong'] # 指定默认字体
mpl.rcParams['axes.unicode_minus'] = False # 解决保存图像是负号'-'显示为方块的问题
1. Import data for each data coastal city
ferrara1 = pd.read_csv('./ferrara_150715.csv')
ferrara2 = pd.read_csv('./ferrara_250715.csv')
ferrara3 = pd.read_csv('./ferrara_270615.csv')
ferrara=pd.concat([ferrara1,ferrara2,ferrara3],ignore_index=True)
# ignore_index是否忽略行索引(显式索引)

torino1 = pd.read_csv('./torino_150715.csv')
torino2 = pd.read_csv('./torino_250715.csv')
torino3 = pd.read_csv('./torino_270615.csv')
torino = pd.concat([torino1,torino2,torino3],ignore_index=True)

mantova1 = pd.read_csv('./mantova_150715.csv')
mantova2 = pd.read_csv('./mantova_250715.csv')
mantova3 = pd.read_csv('./mantova_270615.csv')
mantova = pd.concat([mantova1,mantova2,mantova3],ignore_index=True)

milano1 = pd.read_csv('./milano_150715.csv')
milano2 = pd.read_csv('./milano_250715.csv')
milano3 = pd.read_csv('./milano_270615.csv')
milano = pd.concat([milano1,milano2,milano3],ignore_index=True)

ravenna1 = pd.read_csv('./ravenna_150715.csv')
ravenna2 = pd.read_csv('./ravenna_250715.csv')
ravenna3 = pd.read_csv('./ravenna_270615.csv')
ravenna = pd.concat([ravenna1,ravenna2,ravenna3],ignore_index=True)

asti1 = pd.read_csv('./asti_150715.csv')
asti2 = pd.read_csv('./asti_250715.csv')
asti3 = pd.read_csv('./asti_270615.csv')
asti = pd.concat([asti1,asti2,asti3],ignore_index=True)

bologna1 = pd.read_csv('./bologna_150715.csv')
bologna2 = pd.read_csv('./bologna_250715.csv')
bologna3 = pd.read_csv('./bologna_270615.csv')
bologna = pd.concat([bologna1,bologna2,bologna3],ignore_index=True)

piacenza1 = pd.read_csv('./piacenza_150715.csv')
piacenza2 = pd.read_csv('./piacenza_250715.csv')
piacenza3 = pd.read_csv('./piacenza_270615.csv')
piacenza = pd.concat([piacenza1,piacenza2,piacenza3],ignore_index=True)

cesena1 = pd.read_csv('./cesena_150715.csv')
cesena2 = pd.read_csv('./cesena_250715.csv')
cesena3 = pd.read_csv('./cesena_270615.csv')
cesena = pd.concat([cesena1,cesena2,cesena3],ignore_index=True)

faenza1 = pd.read_csv('./faenza_150715.csv')
faenza2 = pd.read_csv('./faenza_250715.csv')
faenza3 = pd.read_csv('./faenza_270615.csv')
faenza = pd.concat([faenza1,faenza2,faenza3],ignore_index=True)
2. Remove useless column
faenza.head()| Unnamed: 0 | temp | humidity | pressure | description | dt | wind_speed | wind_deg | city | day | dist | |
|---|---|---|---|---|---|---|---|---|---|---|---|
| 0 | 0 | 29.40 | 83 | 1015 | moderate rain | 1436863177 | 3.62 | 94.001 | Faenza | 2015-07-14 10:39:37 | 37 |
| 1 | 1 | 30.12 | 78 | 1015 | moderate rain | 1436866759 | 3.10 | 80.000 | Faenza | 2015-07-14 11:39:19 | 37 |
| 2 | 2 | 30.10 | 78 | 1015 | moderate rain | 1436870510 | 3.60 | 70.000 | Faenza | 2015-07-14 12:41:50 | 37 |
| 3 | 3 | 30.75 | 74 | 1015 | moderate rain | 1436874099 | 4.60 | 90.000 | Faenza | 2015-07-14 13:41:39 | 37 |
| 4 | 4 | 30.71 | 66 | 1015 | moderate rain | 1436877646 | 5.10 | 100.000 | Faenza | 2015-07-14 14:40:46 | 37 |
city_list = [ferrara,torino,mantova,milano,ravenna,asti,bologna,piacenza,cesena,faenza]
for city in city_list:
    city.drop(labels='Unnamed: 0',axis=1,inplace=True)
3. Display the maximum temperature in the relationship of distance from the sea (observed multiple cities)
max_temp = []    # 10个城市的最高温度
cities_dist = [] # 10个城市距离海洋的距离

for city in city_list:
    max_temp.append(city['temp'].max())
cities_dist.append(city['dist'].max())max_temp[33.43000000000001,
34.69,
34.18000000000001,
34.81,
32.79000000000002,
34.31,
33.850000000000016,
33.920000000000016,
32.81,
32.74000000000001]cities_dist[47, 357, 121, 250, 8, 315, 71, 200, 14, 37]- In the equation:
- x: Arguments
- y: the dependent variable
- y = 5x + 4
- Change the argument will lead to changes in the dependent variable
plt.scatter(cities_dist,max_temp,c='rbyg')
plt.xlabel('距离')
plt.ylabel('最高温度')
plt.title('距离和最高温度之间的关系图')
Text(0.5,1,'距离和最高温度之间的关系图')
- The maximum temperature of one unknown city at the highest temperature forecast based on the current pattern of relations
Machine Learning
- What is the relationship between machine learning (ML) and Artificial intelligence is?
- Machine learning is a means to achieve artificial intelligence technology
- What is the algorithm model (model or m)?
- Special objects. So special is that the integration of the equation inside the object has not yet determined a certain kind of solution.
- Role model algorithm?
- Achieve Prediction: predict an unknown result
- To classify: an unknown classification to classify transactions known taxa
- Focus: solution algorithm model equations that predict or classify results
- sample
- Action: the sample data into the model algorithm allowed inside solvable equation. At this point we can achieve classification algorithm model or predict the function.
- Training model: the sample data into the algorithm to model allowed inside the equation solvability. Only trained classification algorithm can be achieved only model or predict the function!
- component:
- Characteristic data: Argument
- Target data: the dependent variable
- sk-learn library: encapsulates a large number of algorithms model
- Model classification:
- Supervised learning: if the sample data model needs data must contain feature data and target
- Unsupervised Learning: If you need only to have a sample model feature data
- Import sklearn, linear regression algorithm model objects
- The interior of the package model is a linear equation: y = wx + b
# 0.提取样本数据(特征数据,目标数据)
feature = np.array(cities_dist)  # 特征数据
feature = feature.reshape(-1, 1) #  二维形式的特征数据
target = np.array(max_temp) # 目标数据- Model training method call is fit (X, y), y any form (dimensions) of the target data, X represents must be two-dimensional characteristic data
# 1.选择一个模型对象进行实例化
from sklearn.linear_model import LinearRegression
linner = LinearRegression()
# 2.训练模型
linner.fit(feature,target) #X,y
# 3.使用相关的评价指标来评价模型
linner.score(feature,target)
# 4.实现预测
linner.predict([[222],[333]])  #调用方程:y = 3x + 6
array([34.17277041, 34.75520186])# 画出回归曲线
x = np.linspace(0,350,num=100)
y = linner.predict(x.reshape(-1,1))
plt.scatter(cities_dist,max_temp,c='rbyg')
plt.xlabel('距离')
plt.ylabel('最高温度')
plt.title('距离和最高温度之间的关系图')
plt.scatter(x,y)<matplotlib.collections.PathCollection at 0xd0014e0>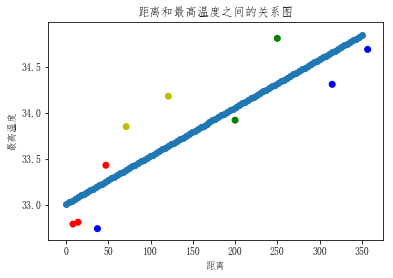
View the relationship between temperature and the minimum distance of the ocean
min_temp = []
for city in city_list:
    min_temp.append(city['temp'].min())
# 0.提取样本数据(特征数据,目标数据)
feature = np.array(cities_dist)  # 特征数据
feature = feature.reshape(-1, 1) # 二维形式的特征数据
target =  np.array(min_temp)     # 目标数据
# 1.选择一个模型对象进行实例化
from sklearn.linear_model import LinearRegression
linner = LinearRegression()
# 2.训练模型
linner.fit(feature,target) #X,y
# 3.使用相关的评价指标来评价模型
linner.score(feature,target)
# 4.实现预测
linner.predict([[222],[333]])
# 画出回归曲线
x = np.linspace(0,350,num=100)
y = linner.predict(x.reshape(-1,1))
plt.scatter(cities_dist,min_temp,c='rbyg')
plt.xlabel('距离')
plt.ylabel('最低温度')
plt.title('距离和最低温度之间的关系图')

plt.scatter(x,y)
<matplotlib.collections.PathCollection at 0x16129f776d8>